Download This statistics in other country:
Timeline:
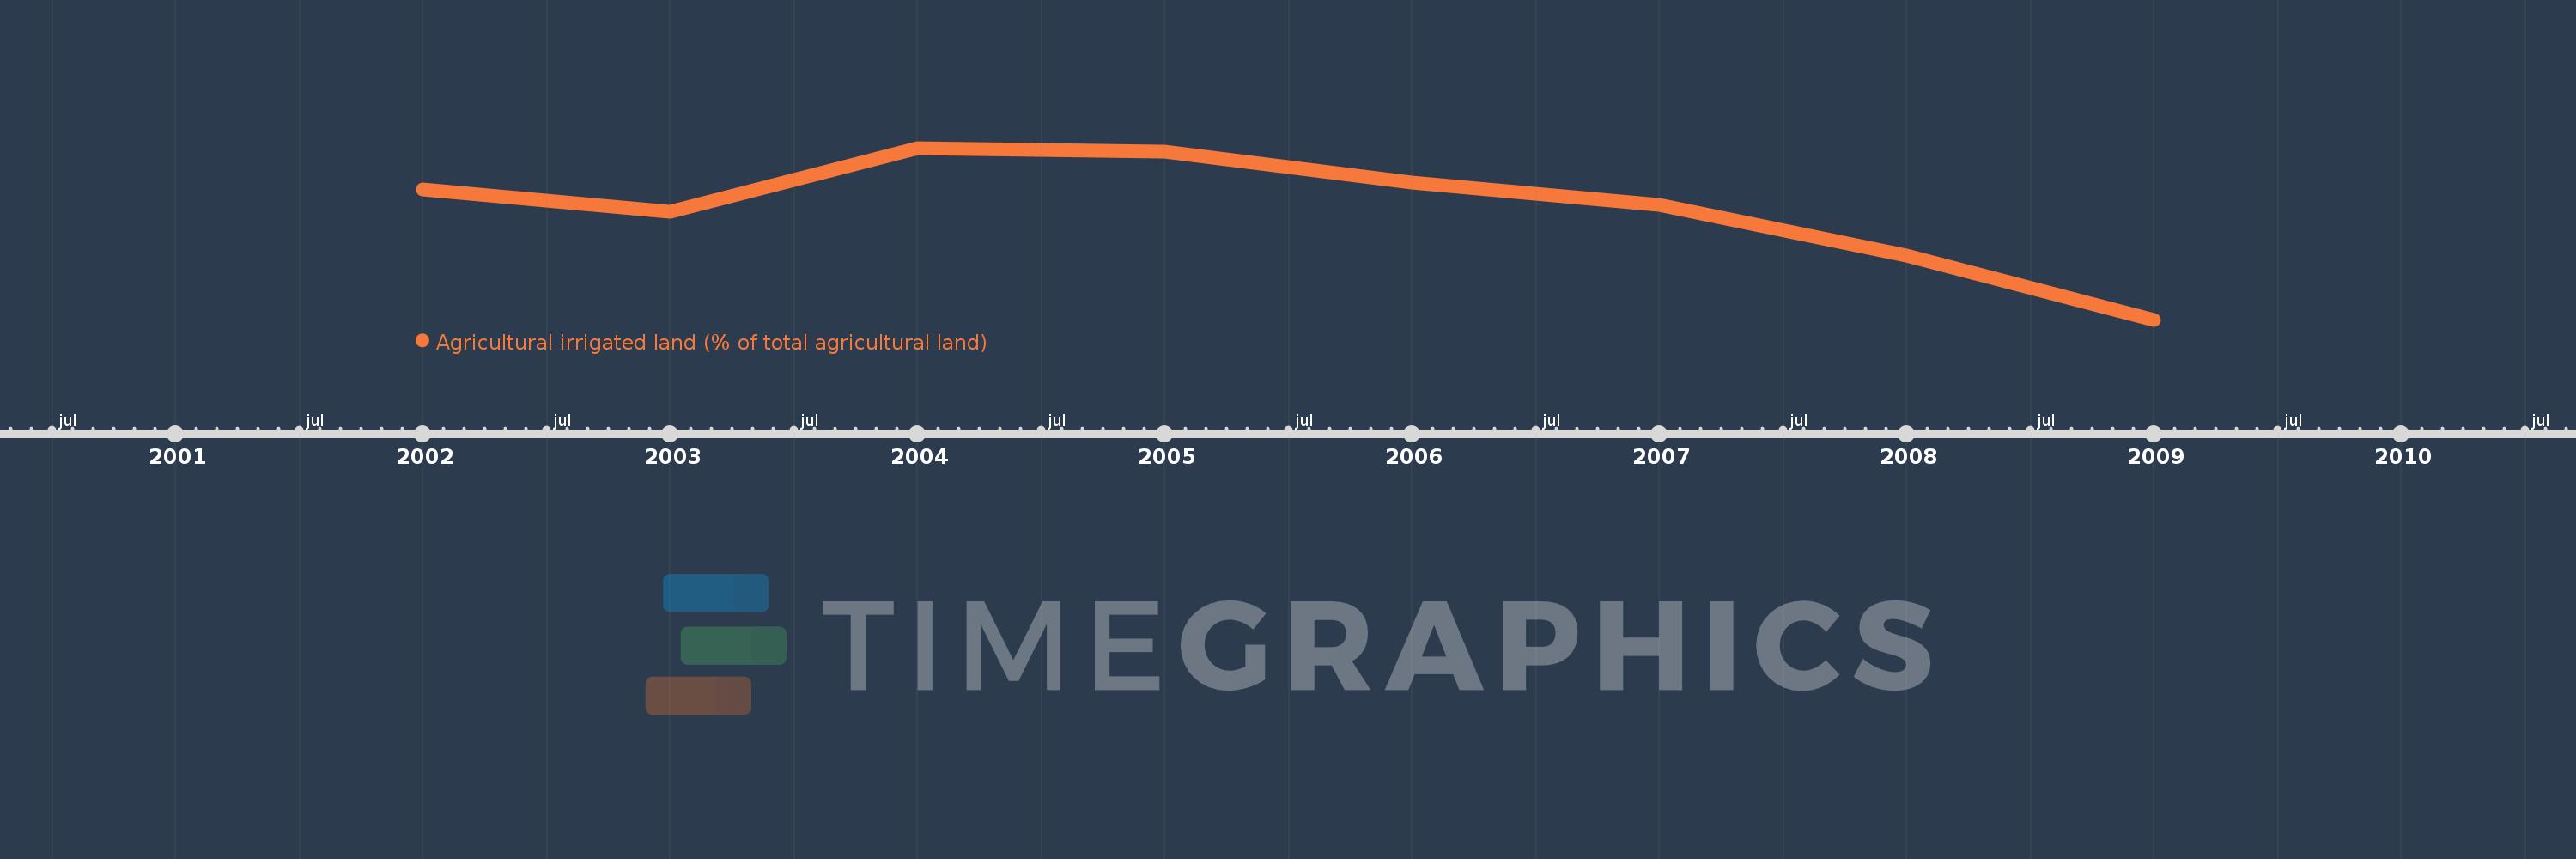
This timeline shows a graph from 2002 to 2009 of Russian Federation. No data until 2001. Number of actual observations by date: 8.
Source name:
World Development Indicators
Source organization:
Food and Agriculture Organization, electronic files and web site.
Categories, topics:
Agriculture & Rural Development, Climate Change
Last updated:
apr 23, 2017
Indicators value changes by year
At the date of observation
Value
Absolute change
Change from the previous value
jan 1, 2002
2.069
+2.069
0.0%
jan 1, 2003
2.052
-0.017
-0.82%
jan 1, 2004
2.1
+0.047
2.31%
jan 1, 2005
2.097
-0.002
-0.11%
jan 1, 2006
2.074
-0.023
-1.1%
jan 1, 2007
2.057
-0.017
-0.83%
jan 1, 2008
2.019
-0.038
-1.84%
jan 1, 2009
1.971
-0.049
-2.4%
Ranking of countries by current statistics by years