33
/
AIzaSyB4mHJ5NPEv-XzF7P6NDYXjlkCWaeKw5bc
November 30, 2025
283376
West Bank and Gaza
PSE
true
2
1
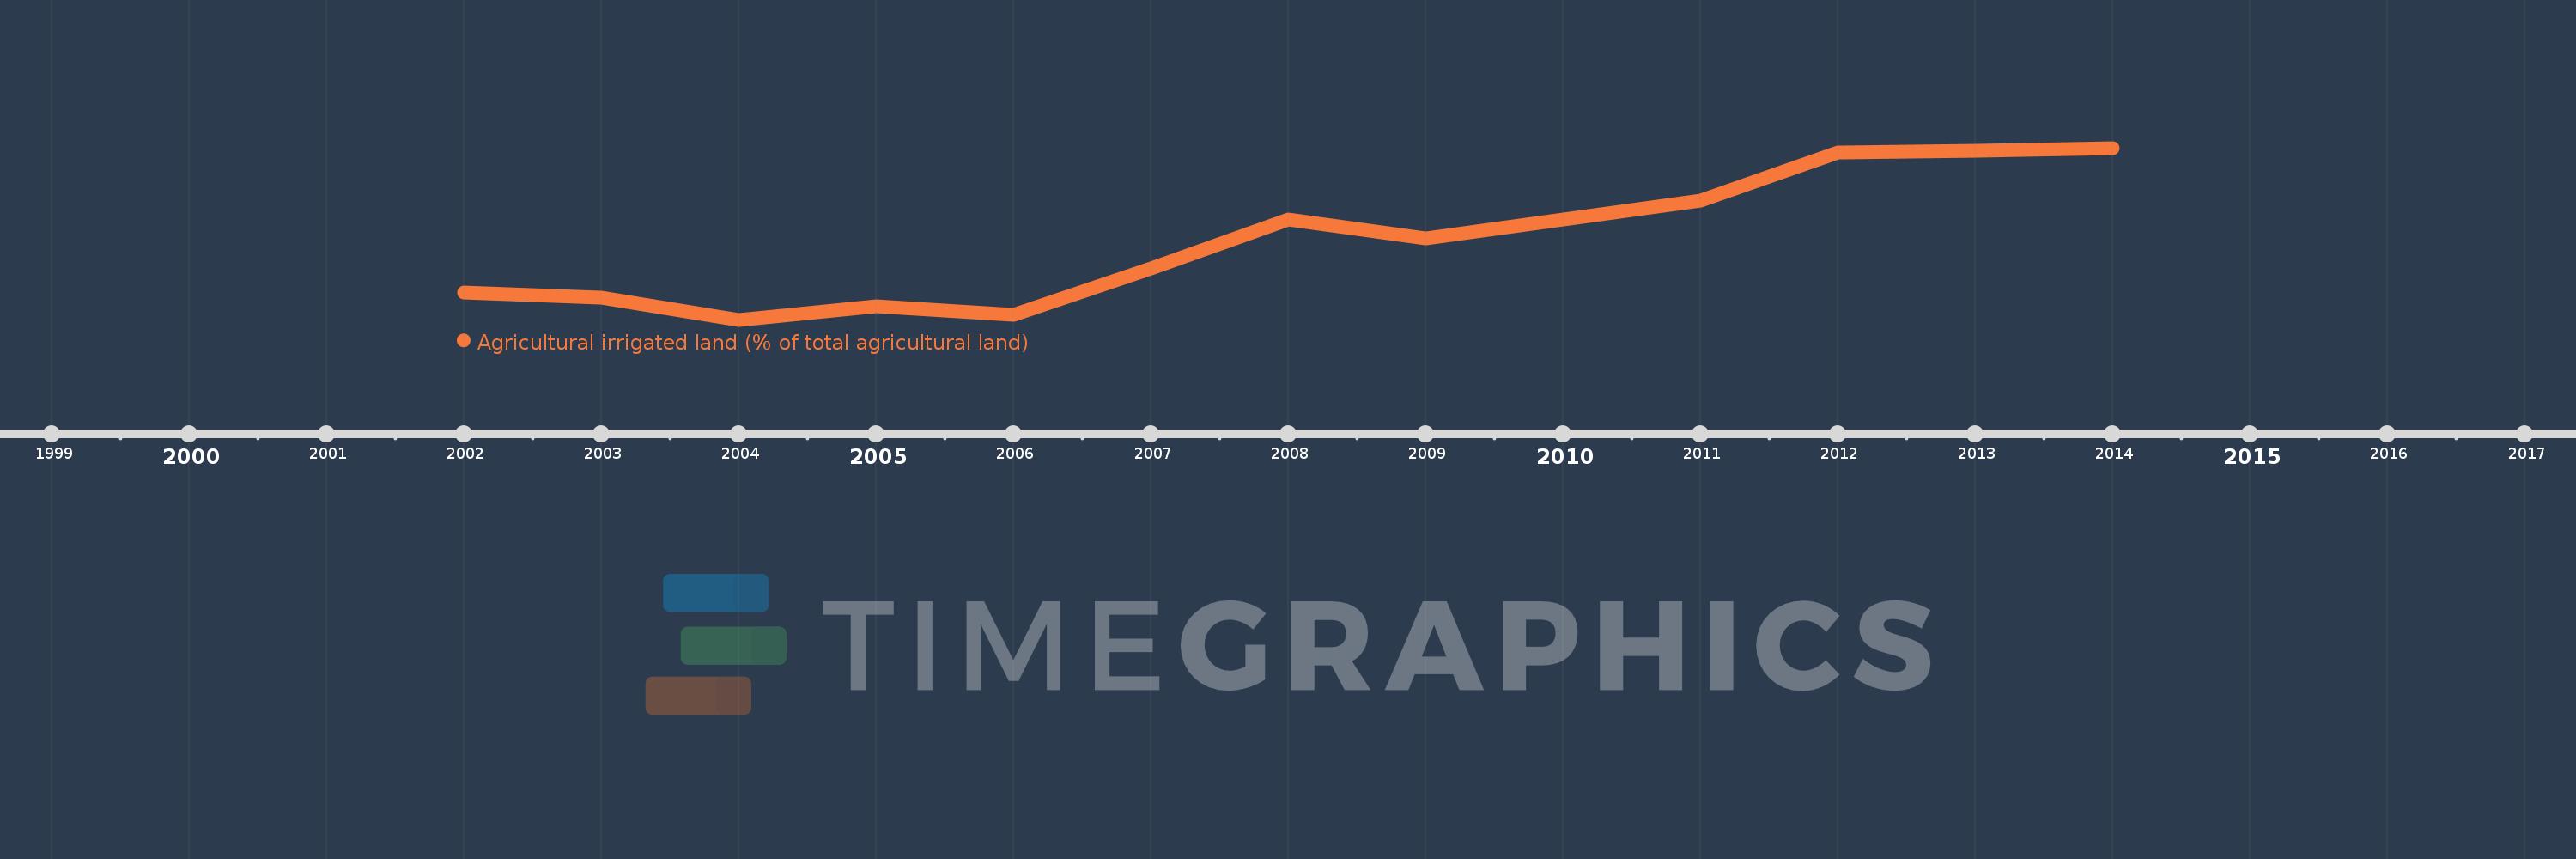
Agricultural irrigated land (% of total agricultural land)
2014,2013,2012,2011,2009,2008,2007,2006,2005,2004,2003,2002
Create a timeline
Public Timelines
For education
For educational institutions
For teachers
For students
Cabinet
For educational institutions
For teachers
For students
Open cabinet
FAQ
Close
Create a timeline
Public timelines
FAQ
About & Feedback
Terms
Privacy
FAQ
Support 24/7
Cabinet
Get premium
Donate
Download
Global statistics library
→
West Bank and Gaza
→
Agricultural irrigated land (% of total agricultural land)
This statistics in other country:
Afghanistan
Albania
Algeria
Argentina
Armenia
Australia
Austria
Azerbaijan
Bahrain
Bangladesh
Belarus
Belgium
Benin
Bhutan
Bolivia
Botswana
Brazil
Brunei Darussalam
Bulgaria
Cabo Verde
Canada
Channel Islands
Chile
China
Colombia
Costa Rica
Croatia
Cyprus
Czech Republic
Denmark
Dominican Republic
Ecuador
El Salvador
Estonia
Ethiopia
Finland
France
Georgia
Germany
Ghana
Greece
Grenada
Guatemala
Guinea
Guyana
Haiti
Honduras
Hungary
India
Indonesia
Iran, Islamic Rep.
Israel
Italy
Jamaica
Japan
Jordan
Kazakhstan
Kenya
Korea, Rep.
Kyrgyz Republic
Lao PDR
Latvia
Lebanon
Lesotho
Lithuania
Macedonia, FYR
Madagascar
Malawi
Malta
Mauritania
Mauritius
Mexico
Moldova
Morocco
Mozambique
Myanmar
Nepal
Netherlands
New Zealand
Niger
Nigeria
Norway
Oman
Pakistan
Panama
Philippines
Poland
Portugal
Puerto Rico
Romania
Russian Federation
Rwanda
Senegal
Serbia
Seychelles
Slovak Republic
Slovenia
South Africa
Spain
St. Kitts and Nevis
Sudan
Swaziland
Sweden
Switzerland
Syrian Arab Republic
Tajikistan
Timor-Leste
Trinidad and Tobago
Tunisia
Turkey
Uganda
Ukraine
United Arab Emirates
United Kingdom
United States
Uruguay
Venezuela, RB
West Bank and Gaza
Yemen, Rep.
Timeline:
This timeline shows a graph from
2002
to
2014
of West Bank and Gaza. No data until
2001
. Number of actual observations by date:
12
.
Source name:
World Development Indicators
Source organization:
Food and Agriculture Organization, electronic files and web site.
Categories, topics:
Agriculture & Rural Development, Climate Change
Last updated:
apr 23, 2017
Indicators value changes by year
Meaning:
4.823
Minimum:
4.196
jan 1, 2004
Maximum:
5.587
jan 1, 2014
At the date of observation
Value
Absolute change
Change from the previous value
jan 1, 2002
4.417
+4.417
0.0%
jan 1, 2003
4.378
-0.039
-0.88%
jan 1, 2004
4.196
-0.182
-4.16%
jan 1, 2005
4.305
+0.109
2.6%
jan 1, 2006
4.233
-0.072
-1.67%
jan 1, 2007
4.613
+0.38
8.97%
jan 1, 2008
5.007
+0.394
8.55%
jan 1, 2009
4.854
-0.153
-3.05%
jan 1, 2011
5.163
+0.309
6.37%
jan 1, 2012
5.549
+0.386
7.47%
jan 1, 2013
5.567
+0.018
0.32%
jan 1, 2014
5.587
+0.021
0.37%
Ranking of countries by current statistics by years
About & Feedback
Terms
Privacy
FAQ
Support 24/7
Cabinet
Get premium
Donate
The service accepts bank transfer (ACH, Wire) or cards (Visa, MasterCard, etc). Processed by Stripe.
Secured with SSL