Download This statistics in other country:
Timeline:
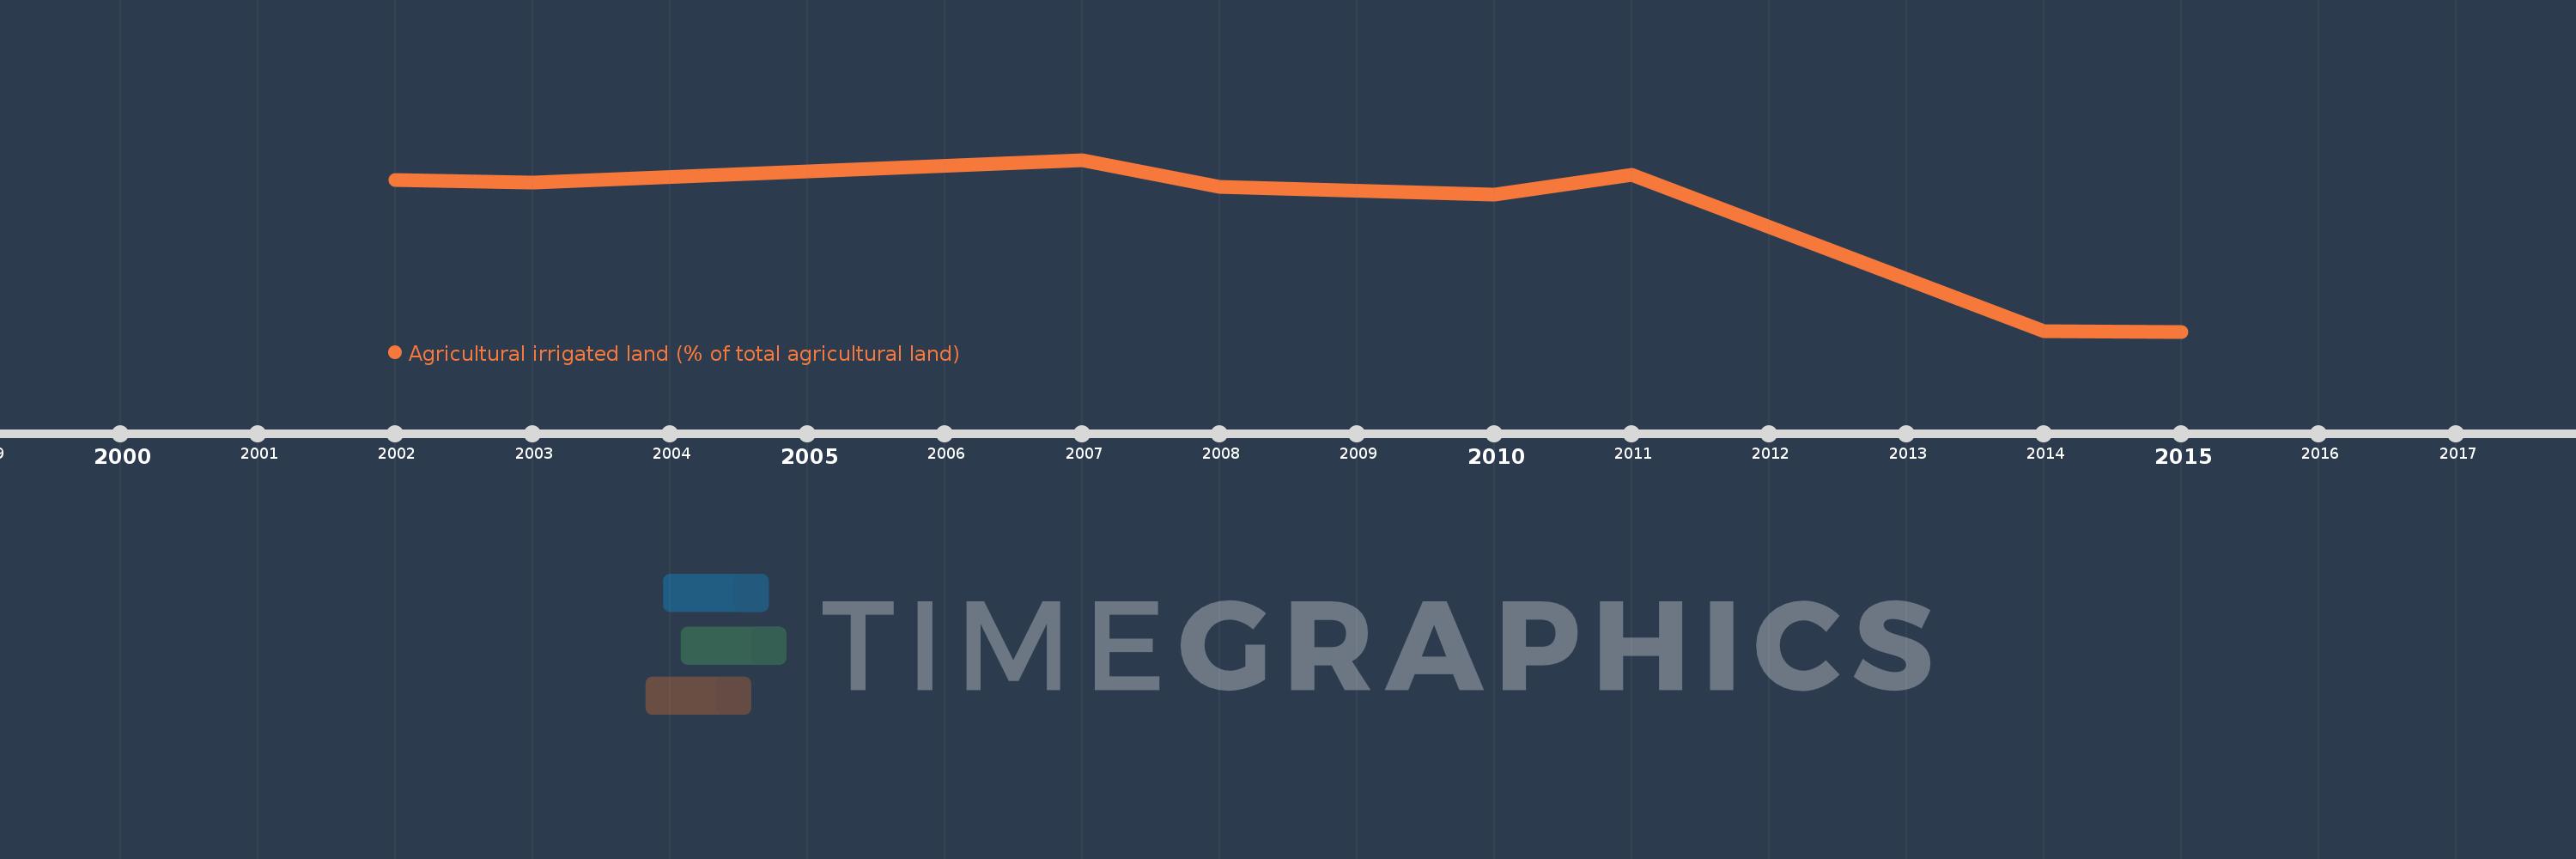
This timeline shows a graph from 2002 to 2015 of Israel. No data until 2001. Number of actual observations by date: 8.
Source name:
World Development Indicators
Source organization:
Food and Agriculture Organization, electronic files and web site.
Categories, topics:
Agriculture & Rural Development, Climate Change
Last updated:
apr 23, 2017
Indicators value changes by year
Maximum:
35.672
jan 1, 2007
At the date of observation
Value
Absolute change
Change from the previous value
jan 1, 2002
31.551
+31.551
0.0%
jan 1, 2003
30.906
-0.645
-2.04%
jan 1, 2007
35.672
+4.766
15.42%
jan 1, 2008
30.014
-5.659
-15.86%
jan 1, 2010
28.377
-1.636
-5.45%
jan 1, 2011
32.587
+4.209
14.83%
jan 1, 2014
0.019
-32.567
-99.94%
jan 1, 2015
0.0
-0.019
-100.0%
Ranking of countries by current statistics by years