Download This statistics in other country:
Timeline:
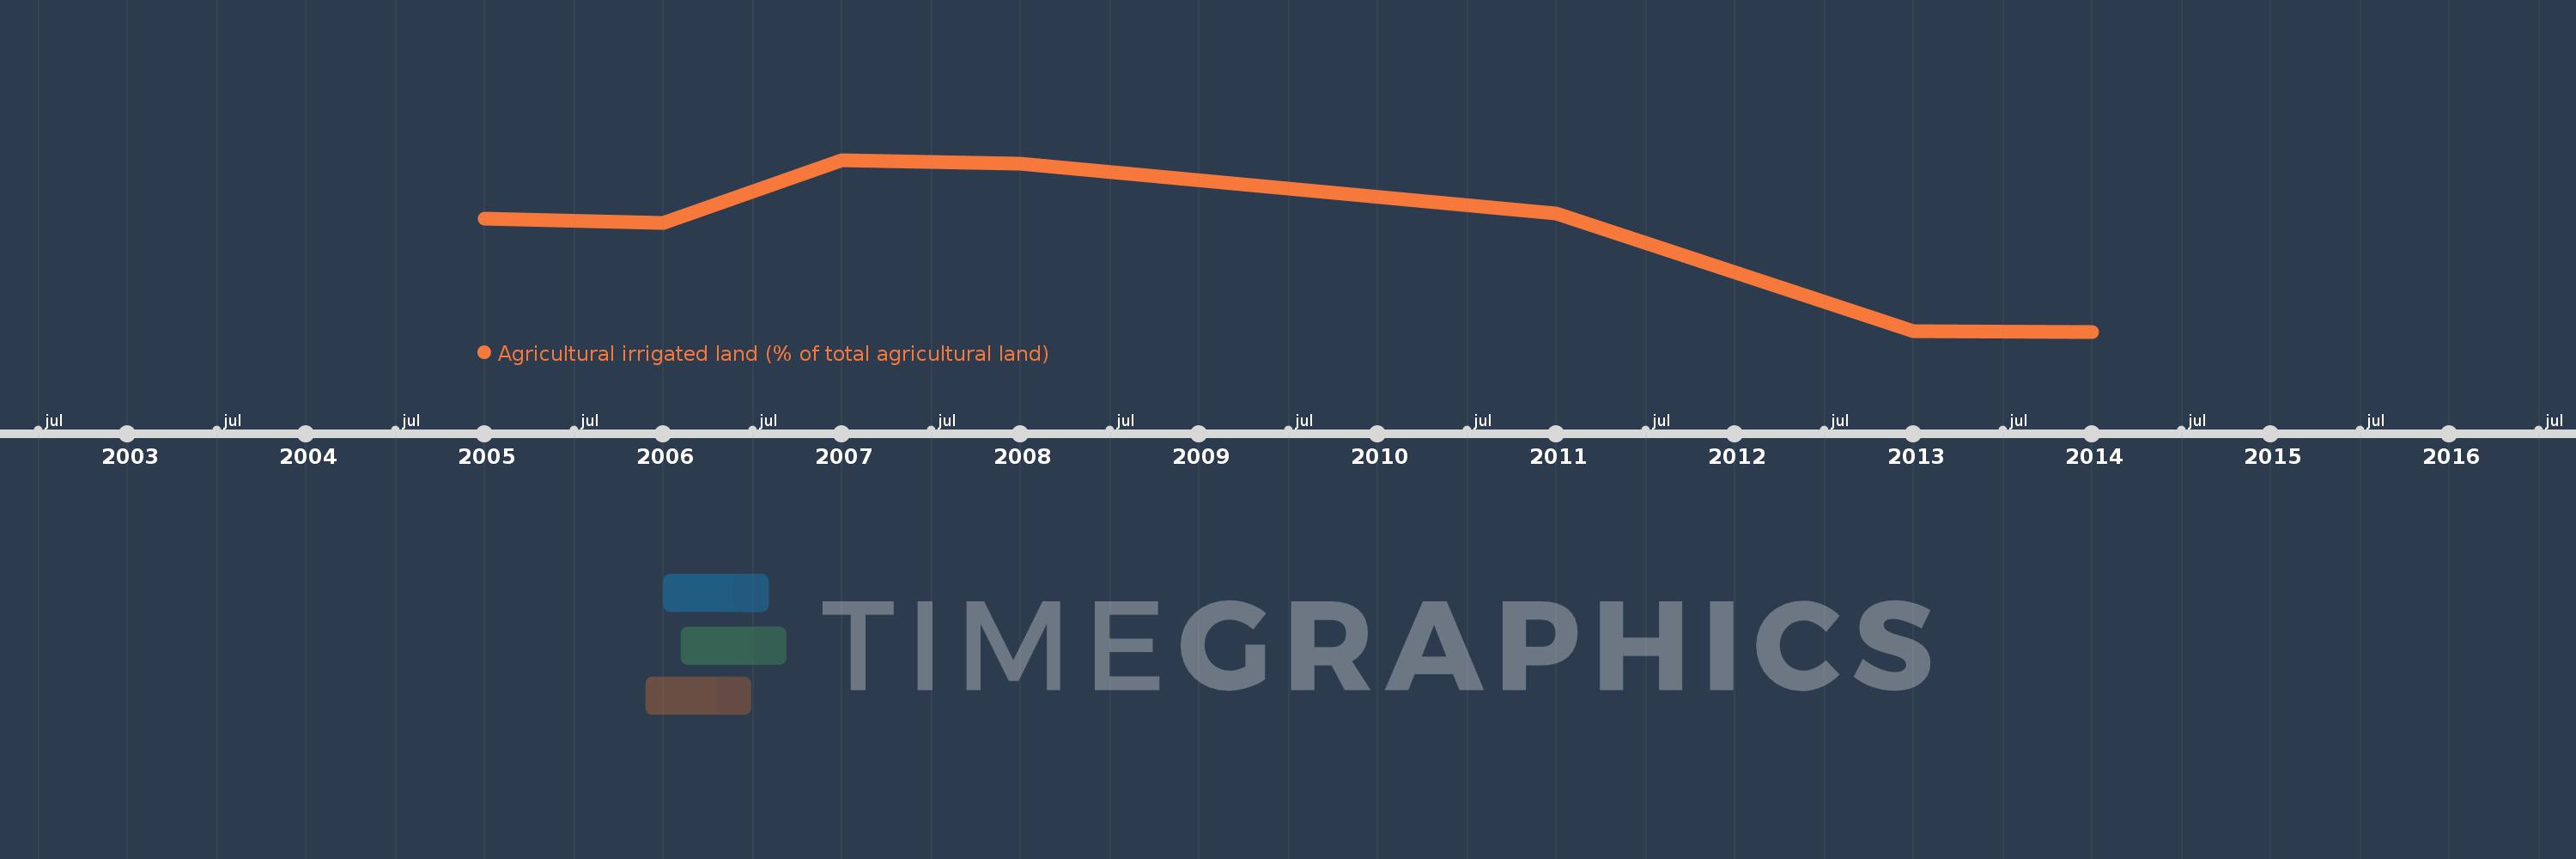
This timeline shows a graph from 2005 to 2014 of Norway. No data until 2004. Number of actual observations by date: 7.
Source name:
World Development Indicators
Source organization:
Food and Agriculture Organization, electronic files and web site.
Categories, topics:
Agriculture & Rural Development, Climate Change
Last updated:
apr 23, 2017
Indicators value changes by year
At the date of observation
Value
Absolute change
Change from the previous value
jan 1, 2005
4.231
+4.231
0.0%
jan 1, 2006
4.151
-0.08
-1.9%
jan 1, 2007
5.411
+1.26
30.36%
jan 1, 2008
5.329
-0.081
-1.5%
jan 1, 2011
4.334
-0.995
-18.67%
jan 1, 2013
1.98
-2.354
-54.31%
jan 1, 2014
1.97
-0.01
-0.5%
Ranking of countries by current statistics by years