Download This statistics in other country:
Timeline:
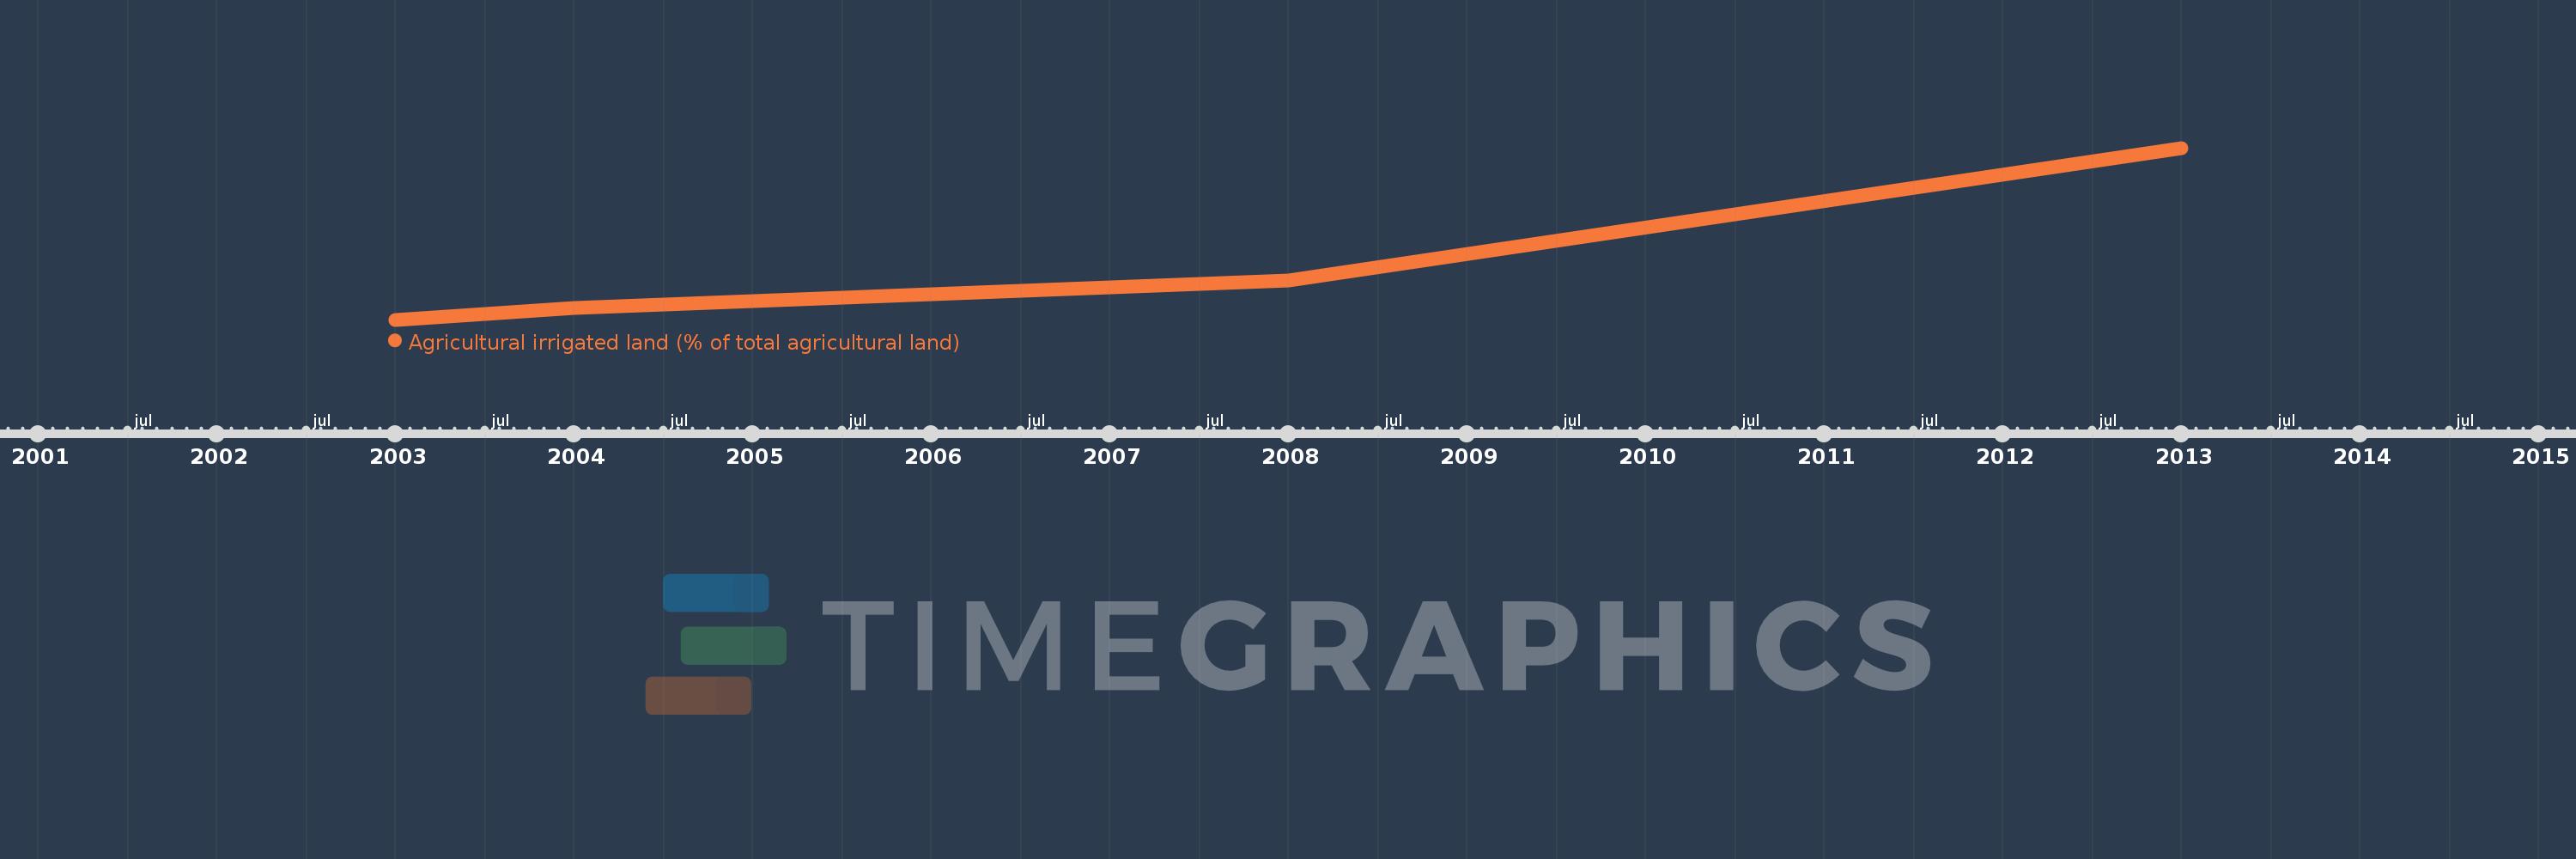
This timeline shows a graph from 2003 to 2013 of Puerto Rico. No data until 2002. Number of actual observations by date: 4.
Source name:
World Development Indicators
Source organization:
Food and Agriculture Organization, electronic files and web site.
Categories, topics:
Agriculture & Rural Development, Climate Change
Last updated:
apr 23, 2017
Indicators value changes by year
Maximum:
10.671
jan 1, 2013
At the date of observation
Value
Absolute change
Change from the previous value
jan 1, 2003
7.658
+7.658
0.0%
jan 1, 2004
7.87
+0.213
2.78%
jan 1, 2008
8.349
+0.479
6.08%
jan 1, 2013
10.671
+2.322
27.81%
Ranking of countries by current statistics by years