Download This statistics in other country:
Timeline:
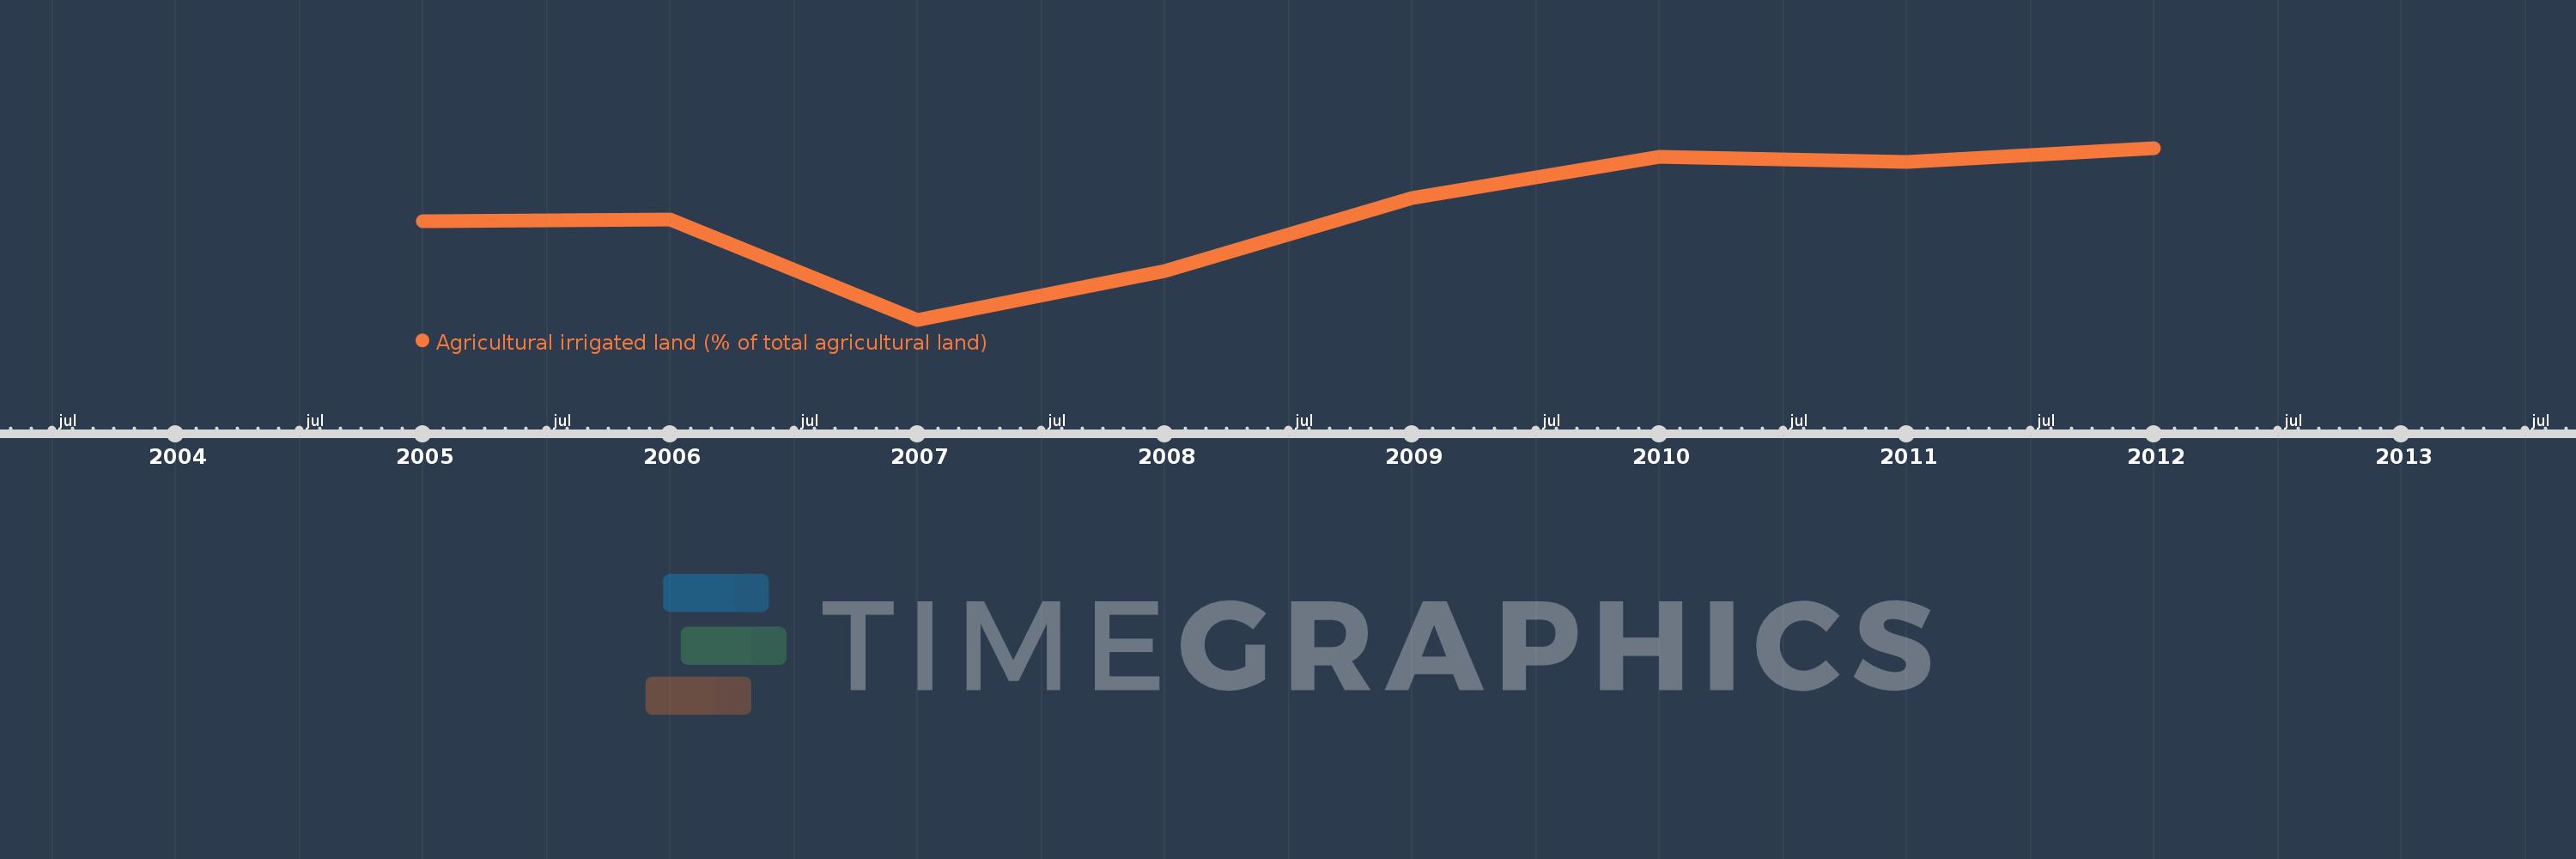
This timeline shows a graph from 2005 to 2012 of Morocco. No data until 2004. Number of actual observations by date: 8.
Source name:
World Development Indicators
Source organization:
Food and Agriculture Organization, electronic files and web site.
Categories, topics:
Agriculture & Rural Development, Climate Change
Last updated:
apr 23, 2017
Indicators value changes by year
At the date of observation
Value
Absolute change
Change from the previous value
jan 1, 2005
4.297
+4.297
0.0%
jan 1, 2006
4.305
+0.007
0.17%
jan 1, 2007
3.88
-0.425
-9.87%
jan 1, 2008
4.086
+0.206
5.31%
jan 1, 2009
4.393
+0.307
7.51%
jan 1, 2010
4.568
+0.175
3.99%
jan 1, 2011
4.548
-0.02
-0.43%
jan 1, 2012
4.606
+0.058
1.27%
Ranking of countries by current statistics by years