Download This statistics in other country:
Timeline:
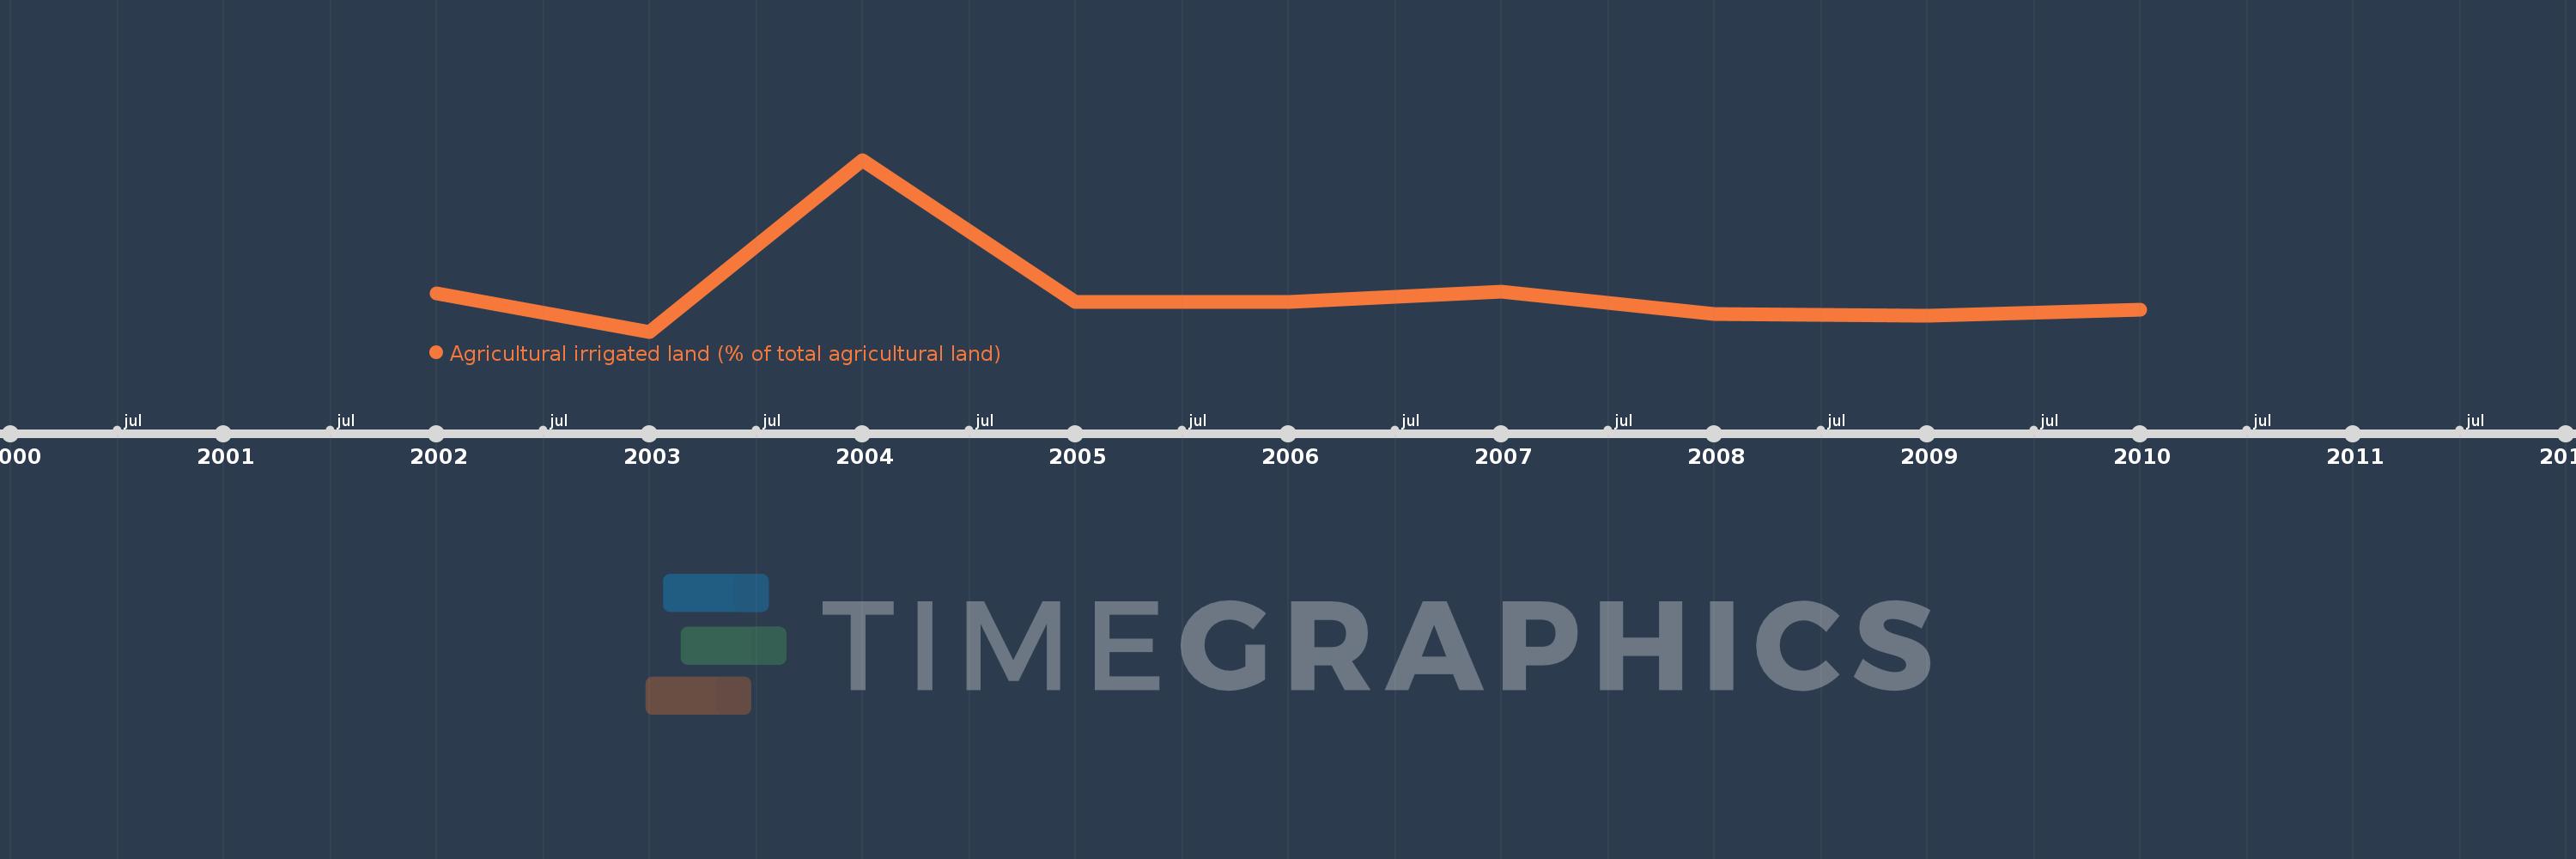
This timeline shows a graph from 2002 to 2010 of Kenya. No data until 2001. Number of actual observations by date: 9.
Source name:
World Development Indicators
Source organization:
Food and Agriculture Organization, electronic files and web site.
Categories, topics:
Agriculture & Rural Development, Climate Change
Last updated:
apr 23, 2017
Indicators value changes by year
At the date of observation
Value
Absolute change
Change from the previous value
jan 1, 2002
0.045
+0.045
0.0%
jan 1, 2003
0.026
-0.019
-41.62%
jan 1, 2004
0.112
+0.086
327.68%
jan 1, 2005
0.041
-0.071
-63.49%
jan 1, 2006
0.041
0.0
-0.04%
jan 1, 2007
0.046
+0.005
13.42%
jan 1, 2008
0.035
-0.011
-23.25%
jan 1, 2009
0.034
-0.002
-5.26%
jan 1, 2010
0.037
+0.003
10.18%
Ranking of countries by current statistics by years