Download This statistics in other country:
Timeline:
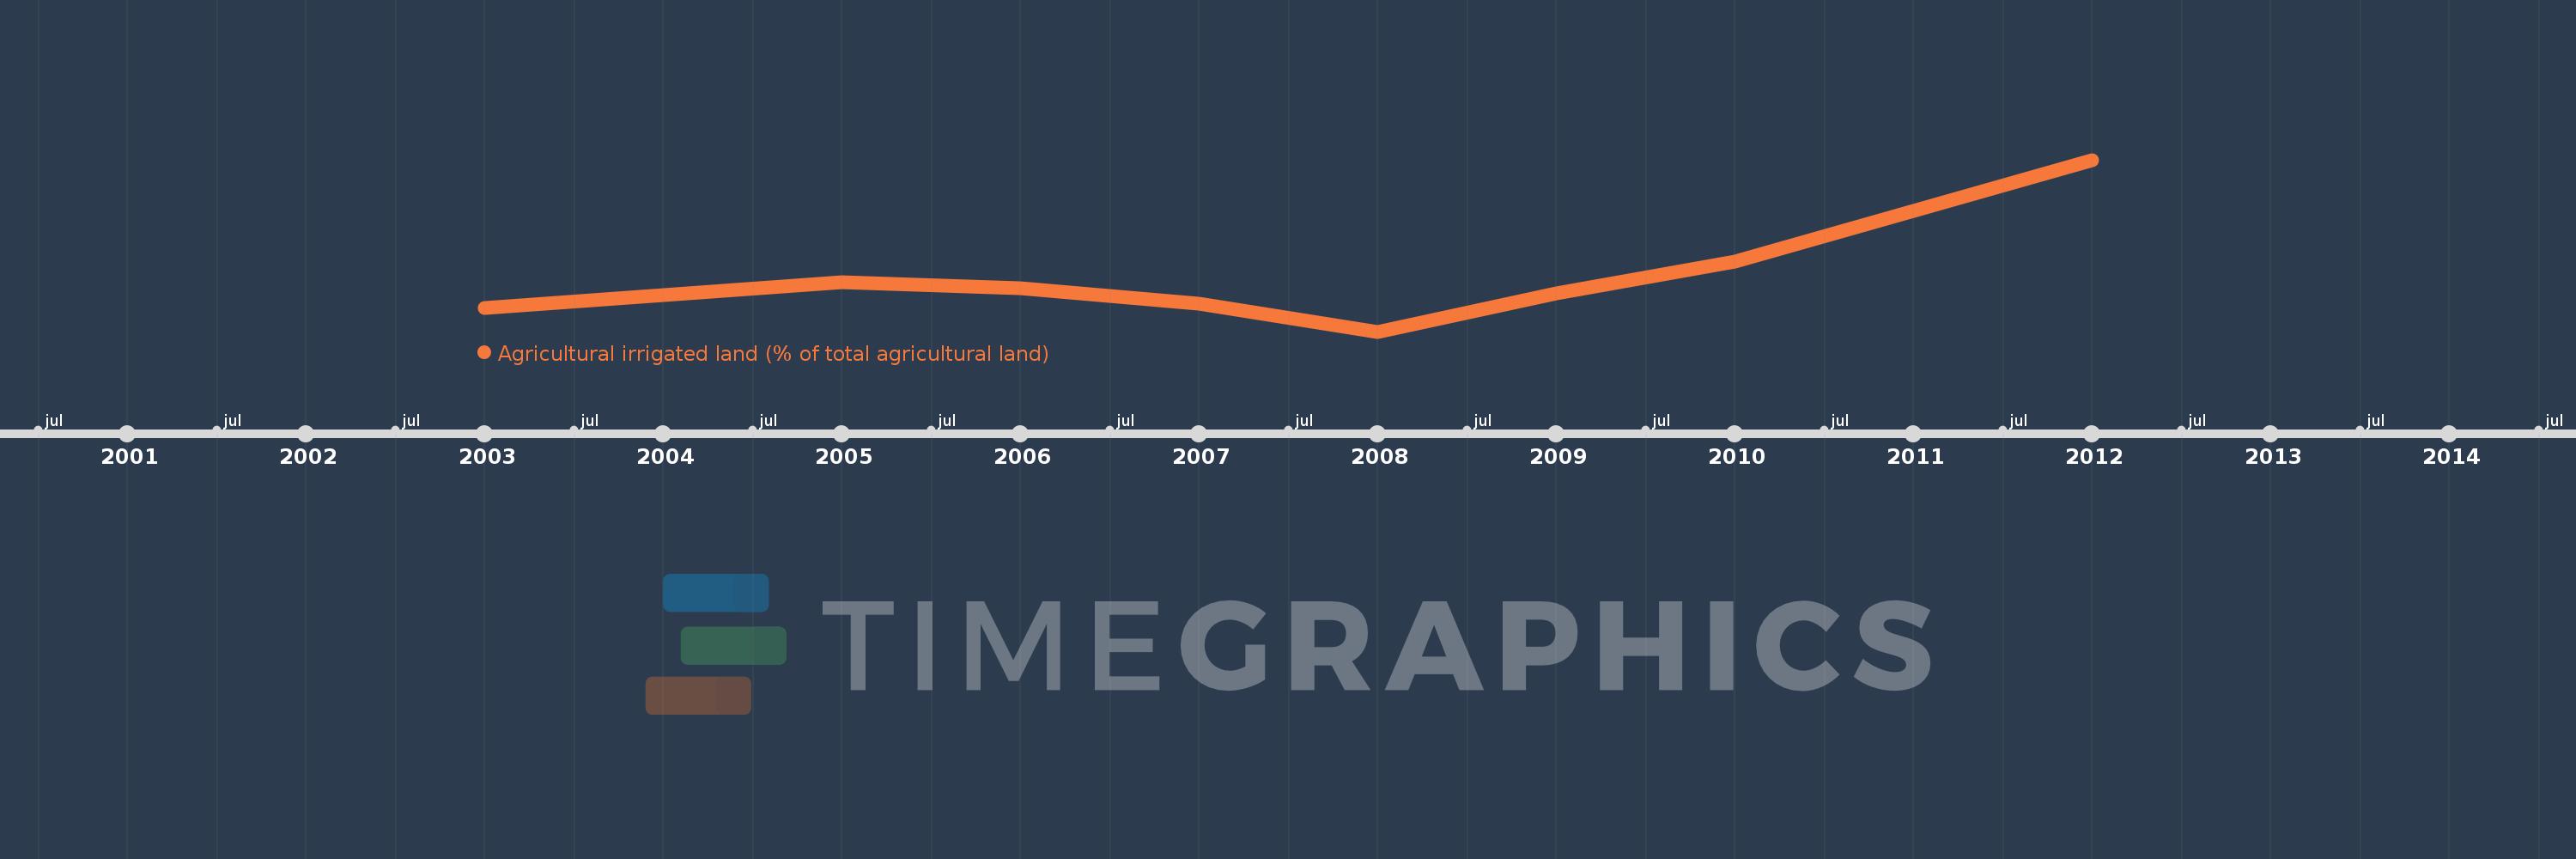
This timeline shows a graph from 2003 to 2012 of Sudan. No data until 2002. Number of actual observations by date: 9.
Source name:
World Development Indicators
Source organization:
Food and Agriculture Organization, electronic files and web site.
Categories, topics:
Agriculture & Rural Development, Climate Change
Last updated:
apr 23, 2017
Indicators value changes by year
At the date of observation
Value
Absolute change
Change from the previous value
jan 1, 2003
1.035
+1.035
0.0%
jan 1, 2004
1.134
+0.1
9.64%
jan 1, 2005
1.233
+0.099
8.74%
jan 1, 2006
1.19
-0.044
-3.53%
jan 1, 2007
1.073
-0.117
-9.82%
jan 1, 2008
0.857
-0.216
-20.12%
jan 1, 2009
1.151
+0.294
34.25%
jan 1, 2010
1.395
+0.244
21.2%
jan 1, 2012
2.173
+0.778
55.78%
Ranking of countries by current statistics by years