Download This statistics in other country:
Timeline:
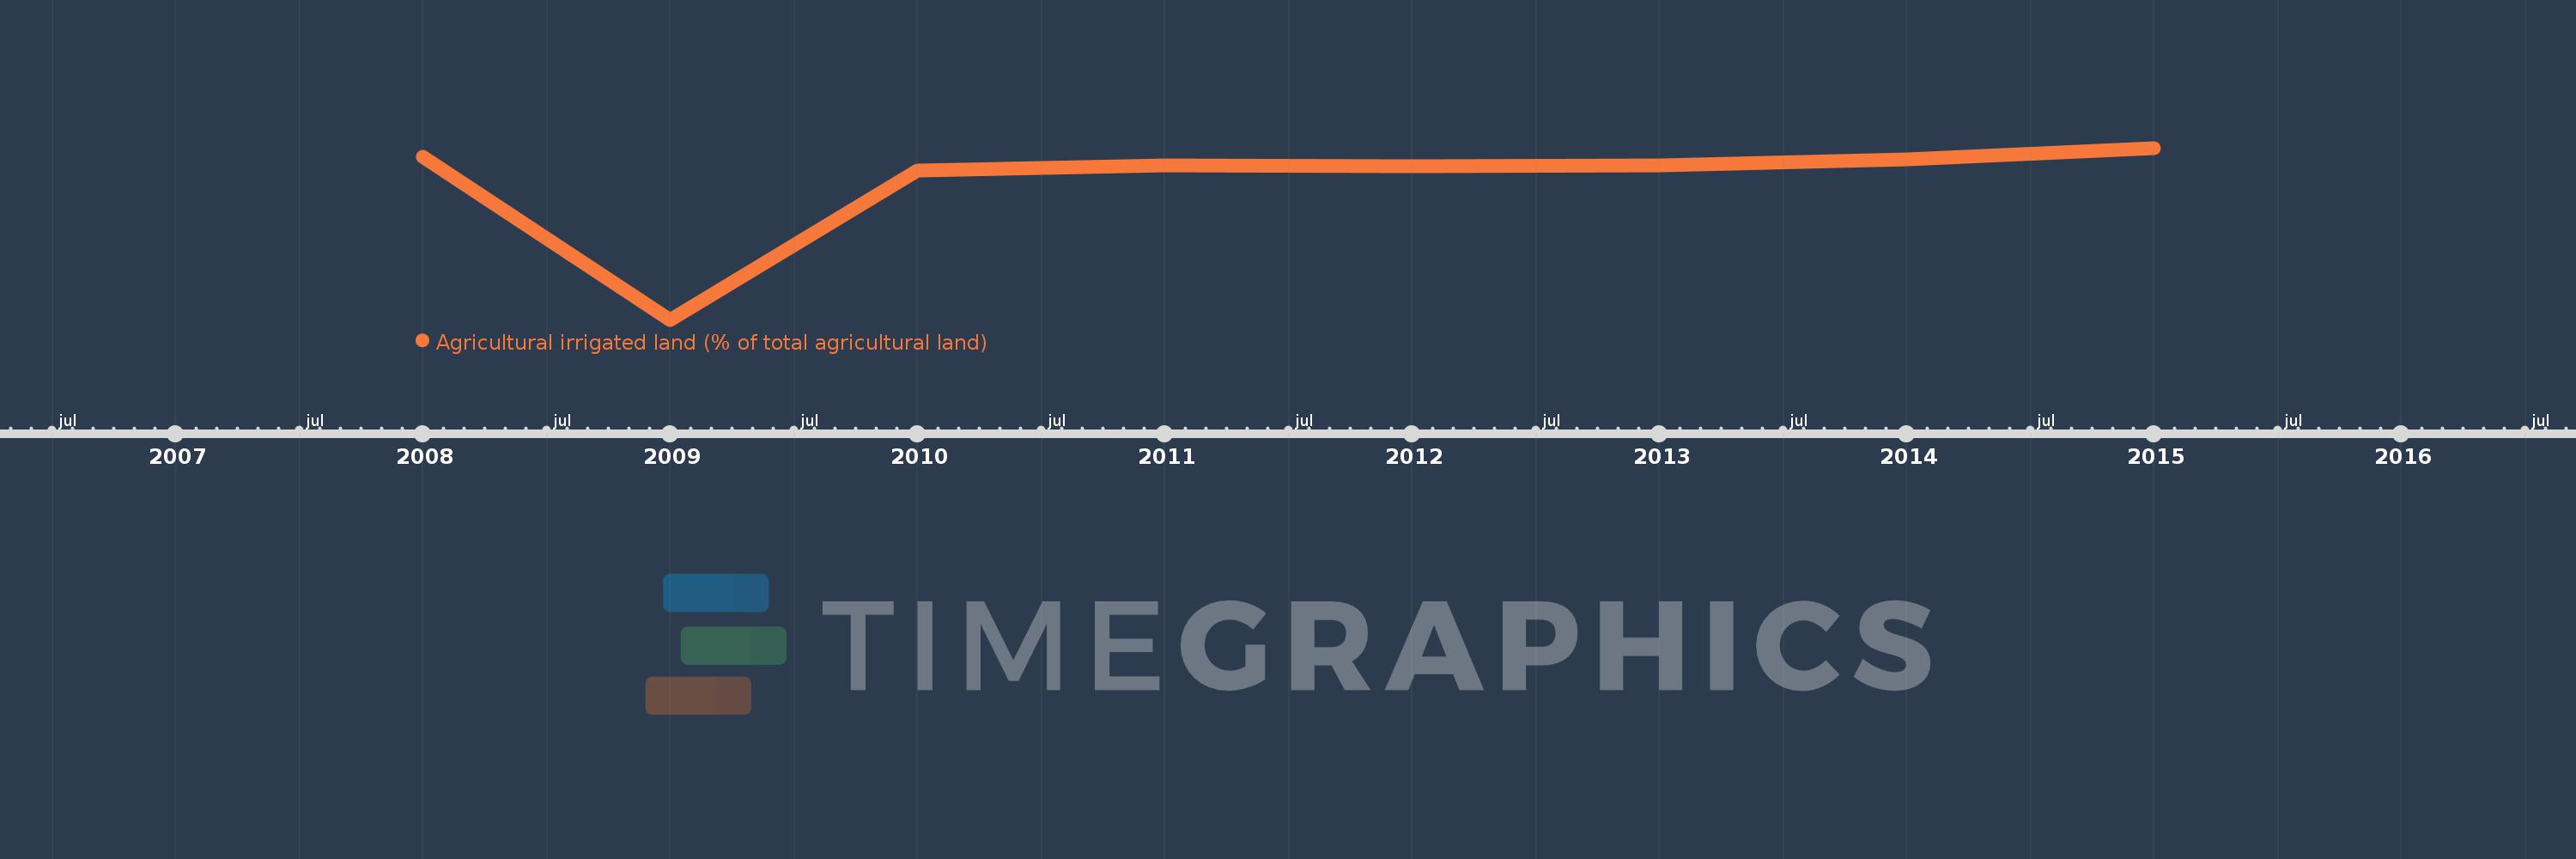
This timeline shows a graph from 2008 to 2015 of Albania. No data until 2007. Number of actual observations by date: 8.
Source name:
World Development Indicators
Source organization:
Food and Agriculture Organization, electronic files and web site.
Categories, topics:
Agriculture & Rural Development, Climate Change
Last updated:
apr 23, 2017
Indicators value changes by year
Maximum:
17.828
jan 1, 2015
At the date of observation
Value
Absolute change
Change from the previous value
jan 1, 2008
17.426
+17.426
0.0%
jan 1, 2009
9.992
-7.435
-42.66%
jan 1, 2010
16.815
+6.824
68.29%
jan 1, 2011
17.023
+0.208
1.24%
jan 1, 2012
17.011
-0.012
-0.07%
jan 1, 2013
17.04
+0.029
0.17%
jan 1, 2014
17.288
+0.248
1.46%
jan 1, 2015
17.828
+0.54
3.12%
Ranking of countries by current statistics by years