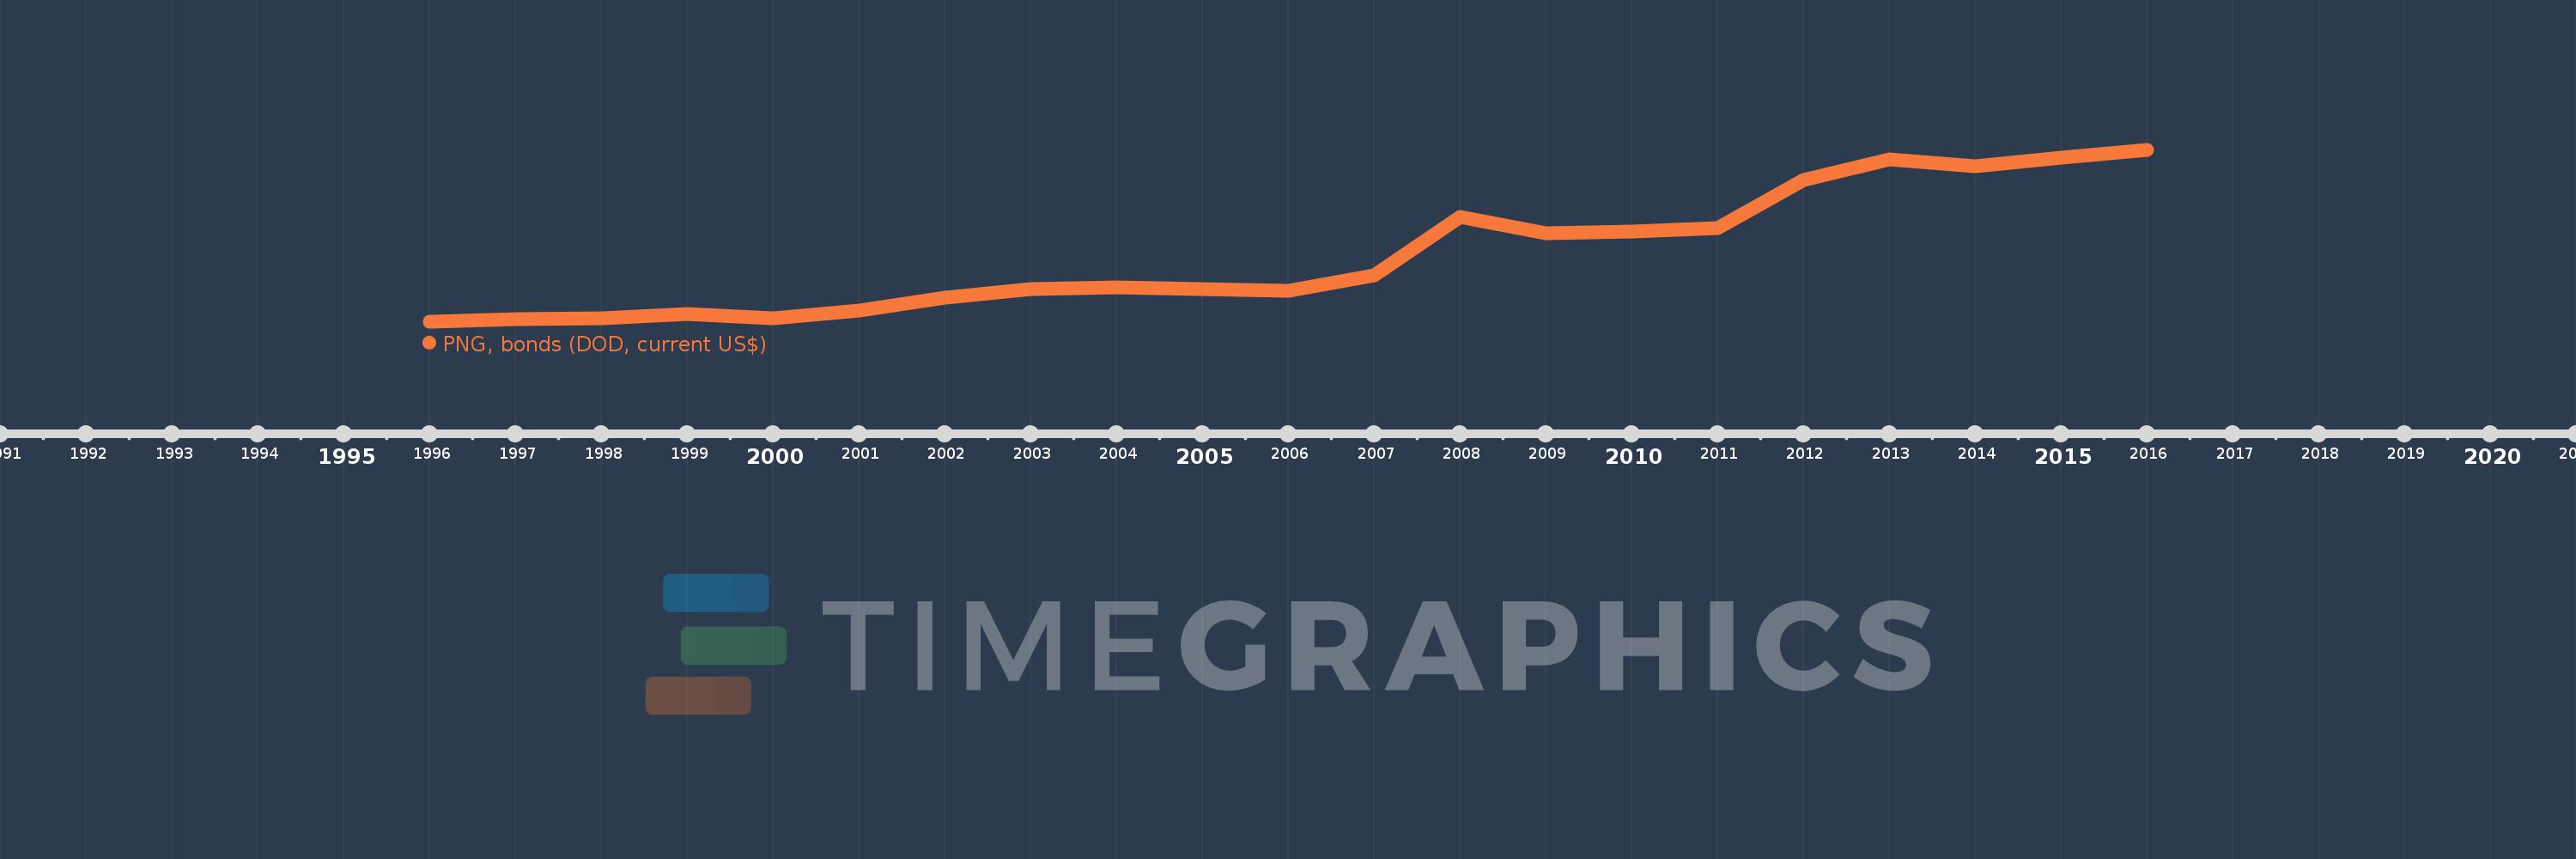
This timeline shows a graph from 1996 to 2016 of Sub-Saharan Africa (excluding high income). No data until 1995. Number of actual observations by date: 21.
Source name:
World Development Indicators
Source organization:
World Bank, International Debt Statistics.
Categories, topics:
External Debt
Last updated:
apr 23, 2017
Indicators value changes by year
Meaning:
6.376 bln
Minimum:
350.0 mln
jan 1, 1996
Maximum:
15.837 bln
jan 1, 2016
At the date of observation
Value
Absolute change
Change from the previous value
jan 1, 1996
350.0 mln
+350.0 mln
0.0%
jan 1, 1997
600.0 mln
+250.0 mln
71.43%
jan 1, 1998
645.0 mln
+45.0 mln
7.5%
jan 1, 1999
1.036 bln
+391.254 mln
60.66%
jan 1, 2000
645.0 mln
-391.254 mln
-37.76%
jan 1, 2001
1.36 bln
+715.25 mln
110.89%
jan 1, 2002
2.557 bln
+1.196 bln
87.95%
jan 1, 2003
3.316 bln
+759.45 mln
29.71%
jan 1, 2004
3.435 bln
+119.0 mln
3.59%
jan 1, 2005
3.286 bln
-149.0 mln
-4.34%
jan 1, 2006
3.196 bln
-90.0 mln
-2.74%
jan 1, 2007
4.535 bln
+1.339 bln
41.9%
jan 1, 2008
9.835 bln
+5.3 bln
116.87%
jan 1, 2009
8.322 bln
-1.513 bln
-15.38%
jan 1, 2010
8.485 bln
+163.0 mln
1.96%
jan 1, 2011
8.786 bln
+301.0 mln
3.55%
jan 1, 2012
13.138 bln
+4.352 bln
49.53%
jan 1, 2013
14.999 bln
+1.861 bln
14.16%
jan 1, 2014
14.357 bln
-642.0 mln
-4.28%
jan 1, 2015
15.174 bln
+817.019 mln
5.69%
jan 1, 2016
15.837 bln
+663.395 mln
4.37%
Ranking of countries by current statistics by years