33
/
AIzaSyB4mHJ5NPEv-XzF7P6NDYXjlkCWaeKw5bc
November 30, 2025
106426
China
CHN
true
2
1
PNG, bonds (DOD, current US$)
2016,2015,2014,2013,2012,2011,2010,2009,2008,2007,2006,2005,2004,2003,2002,2001,2000,1999,1998,1997,1996,1995,1994,1993
Create a timeline
Public Timelines
For education
For educational institutions
For teachers
For students
Cabinet
For educational institutions
For teachers
For students
Open cabinet
FAQ
Close
Create a timeline
Public timelines
FAQ
About & Feedback
Terms
Privacy
FAQ
Support 24/7
Cabinet
Get premium
Donate
Download
Global statistics library
→
China
→
PNG, bonds (DOD, current US$)
This statistics in other country:
Argentina
Armenia
Botswana
Brazil
Bulgaria
China
Colombia
Costa Rica
Dominican Republic
East Asia & Pacific (excluding high income)
Ecuador
Egypt, Arab Rep.
El Salvador
Europe & Central Asia (excluding high income)
Georgia
Ghana
Guatemala
IDA only
India
Indonesia
Jamaica
Kazakhstan
Lao PDR
Latin America & Caribbean (excluding high income)
Lebanon
Low & middle income
Lower middle income
Malaysia
Mexico
Middle East & North Africa (excluding high income)
Middle income
Mongolia
Nigeria
Pakistan
Panama
Paraguay
Peru
Philippines
Romania
Russian Federation
Serbia
South Africa
South Asia
Sri Lanka
Sub-Saharan Africa (excluding high income)
Thailand
Turkey
Ukraine
Upper middle income
Venezuela, RB
Vietnam
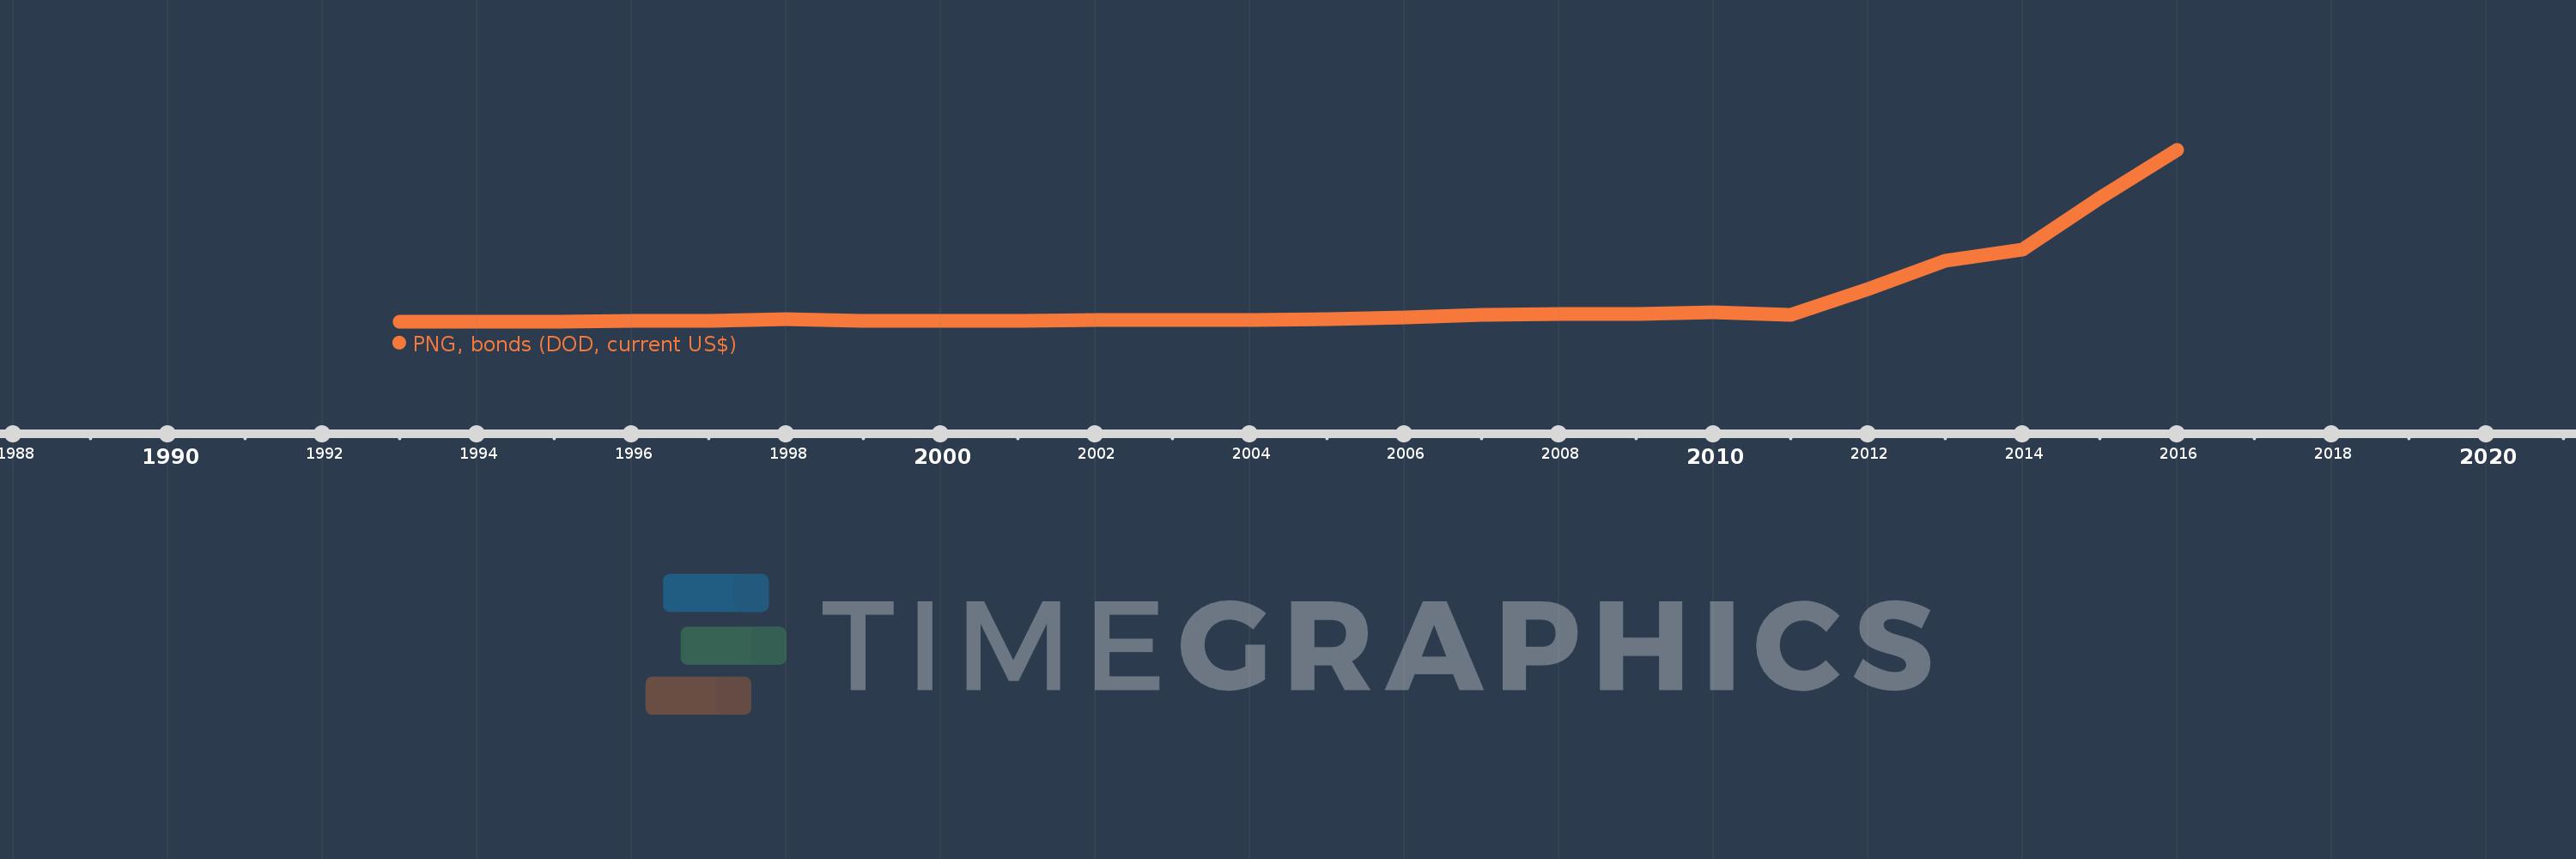
Timeline:
This timeline shows a graph from
1993
to
2016
of China. No data until
1992
. Number of actual observations by date:
24
.
Source name:
World Development Indicators
Source organization:
World Bank, International Debt Statistics.
Categories, topics:
External Debt
Last updated:
apr 23, 2017
Indicators value changes by year
Meaning:
15.983 bln
Minimum:
200.401 mln
jan 1, 1993
Maximum:
123.982 bln
jan 1, 2016
At the date of observation
Value
Absolute change
Change from the previous value
jan 1, 1993
200.401 mln
+200.401 mln
0.0%
jan 1, 1994
555.514 mln
+355.113 mln
177.2%
jan 1, 1995
582.652 mln
+27.138 mln
4.89%
jan 1, 1996
1.09 bln
+507.211 mln
87.05%
jan 1, 1997
1.15 bln
+59.965 mln
5.5%
jan 1, 1998
2.412 bln
+1.262 bln
109.74%
jan 1, 1999
1.198 bln
-1.214 bln
-50.34%
jan 1, 2000
1.248 bln
+49.905 mln
4.17%
jan 1, 2001
1.068 bln
-179.651 mln
-14.4%
jan 1, 2002
1.536 bln
+467.941 mln
43.82%
jan 1, 2003
1.54 bln
+4.002 mln
0.26%
jan 1, 2004
1.62 bln
+80.662 mln
5.24%
jan 1, 2005
2.326 bln
+705.617 mln
43.54%
jan 1, 2006
3.574 bln
+1.248 bln
53.64%
jan 1, 2007
5.279 bln
+1.705 bln
47.71%
jan 1, 2008
6.018 bln
+739.033 mln
14.0%
jan 1, 2009
5.97 bln
-47.507 mln
-0.79%
jan 1, 2010
7.02 bln
+1.05 bln
17.59%
jan 1, 2011
5.561 bln
-1.459 bln
-20.79%
jan 1, 2012
23.667 bln
+18.106 bln
325.58%
jan 1, 2013
44.125 bln
+20.458 bln
86.44%
jan 1, 2014
52.353 bln
+8.228 bln
18.65%
jan 1, 2015
89.524 bln
+37.172 bln
71.0%
jan 1, 2016
123.982 bln
+34.457 bln
38.49%
Ranking of countries by current statistics by years
About & Feedback
Terms
Privacy
FAQ
Support 24/7
Cabinet
Get premium
Donate
The service accepts bank transfer (ACH, Wire) or cards (Visa, MasterCard, etc). Processed by Stripe.
Secured with SSL