33
/
AIzaSyB4mHJ5NPEv-XzF7P6NDYXjlkCWaeKw5bc
November 30, 2025
155100
India
IND
true
2
1
PNG, bonds (DOD, current US$)
2016,2015,2014,2013,2012,2011,2010,2009,2008,2007,2006,2005,2004,2003,2002,2001,2000,1999,1998,1997,1996,1995,1994
Create a timeline
Public Timelines
For education
For educational institutions
For teachers
For students
Cabinet
For educational institutions
For teachers
For students
Open cabinet
FAQ
Close
Create a timeline
Public timelines
FAQ
About & Feedback
Terms
Privacy
FAQ
Support 24/7
Cabinet
Get premium
Donate
Download
Global statistics library
→
India
→
PNG, bonds (DOD, current US$)
This statistics in other country:
Argentina
Armenia
Botswana
Brazil
Bulgaria
China
Colombia
Costa Rica
Dominican Republic
East Asia & Pacific (excluding high income)
Ecuador
Egypt, Arab Rep.
El Salvador
Europe & Central Asia (excluding high income)
Georgia
Ghana
Guatemala
IDA only
India
Indonesia
Jamaica
Kazakhstan
Lao PDR
Latin America & Caribbean (excluding high income)
Lebanon
Low & middle income
Lower middle income
Malaysia
Mexico
Middle East & North Africa (excluding high income)
Middle income
Mongolia
Nigeria
Pakistan
Panama
Paraguay
Peru
Philippines
Romania
Russian Federation
Serbia
South Africa
South Asia
Sri Lanka
Sub-Saharan Africa (excluding high income)
Thailand
Turkey
Ukraine
Upper middle income
Venezuela, RB
Vietnam
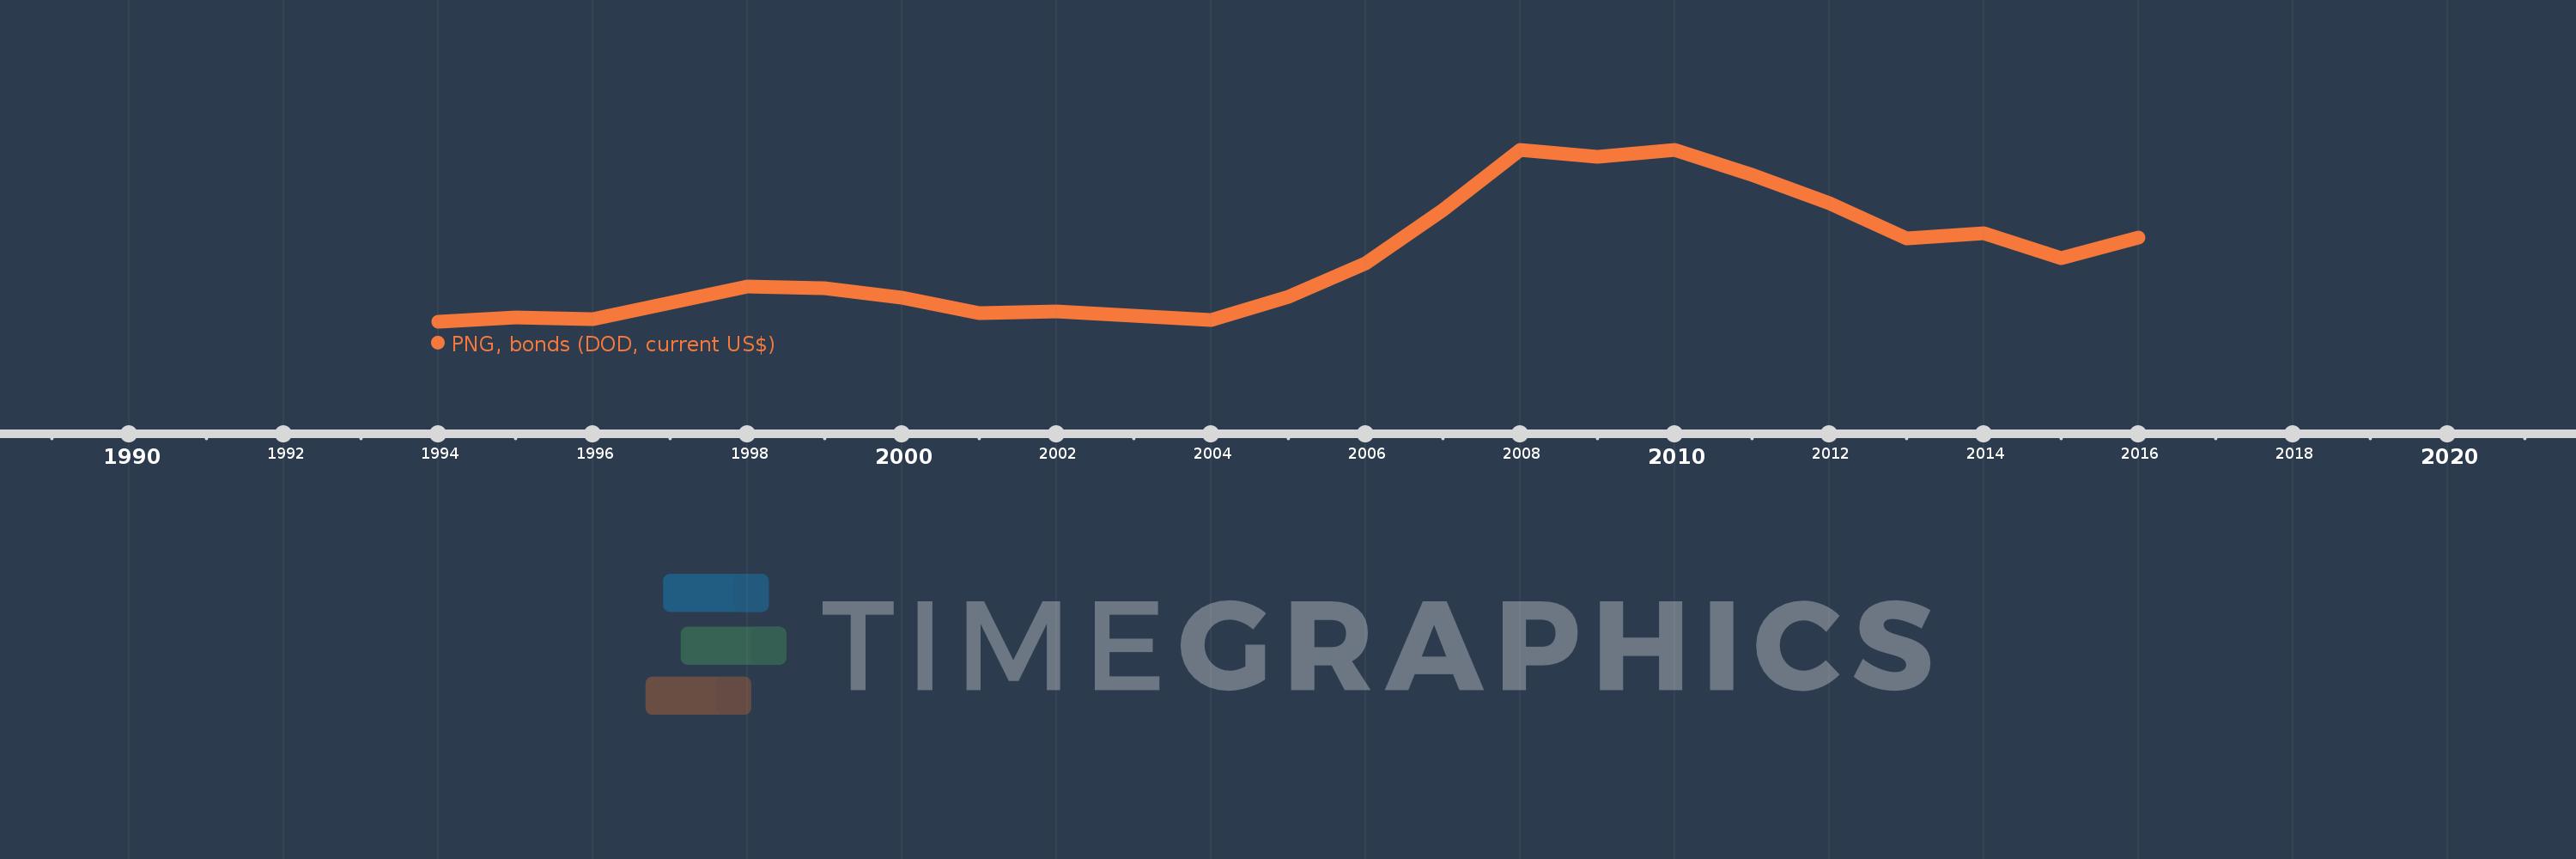
Timeline:
This timeline shows a graph from
1994
to
2016
of India. No data until
1993
. Number of actual observations by date:
23
.
Source name:
World Development Indicators
Source organization:
World Bank, International Debt Statistics.
Categories, topics:
External Debt
Last updated:
apr 23, 2017
Indicators value changes by year
Meaning:
6.081 bln
Minimum:
794.21 mln
jan 1, 1994
Maximum:
15.327 bln
jan 1, 2008
At the date of observation
Value
Absolute change
Change from the previous value
jan 1, 1994
794.21 mln
+794.21 mln
0.0%
jan 1, 1995
1.158 bln
+364.01 mln
45.83%
jan 1, 1996
1.02 bln
-138.22 mln
-11.93%
jan 1, 1997
2.433 bln
+1.413 bln
138.53%
jan 1, 1998
3.802 bln
+1.369 bln
56.28%
jan 1, 1999
3.646 bln
-155.829 mln
-4.1%
jan 1, 2000
2.874 bln
-772.105 mln
-21.17%
jan 1, 2001
1.515 bln
-1.359 bln
-47.29%
jan 1, 2002
1.661 bln
+146.366 mln
9.66%
jan 1, 2003
1.289 bln
-372.246 mln
-22.41%
jan 1, 2004
978.189 mln
-310.931 mln
-24.12%
jan 1, 2005
2.959 bln
+1.98 bln
202.45%
jan 1, 2006
5.761 bln
+2.803 bln
94.74%
jan 1, 2007
10.254 bln
+4.492 bln
77.97%
jan 1, 2008
15.327 bln
+5.073 bln
49.48%
jan 1, 2009
14.732 bln
-594.887 mln
-3.88%
jan 1, 2010
15.326 bln
+593.943 mln
4.03%
jan 1, 2011
13.217 bln
-2.109 bln
-13.76%
jan 1, 2012
10.861 bln
-2.356 bln
-17.83%
jan 1, 2013
7.848 bln
-3.013 bln
-27.74%
jan 1, 2014
8.286 bln
+438.721 mln
5.59%
jan 1, 2015
6.214 bln
-2.072 bln
-25.0%
jan 1, 2016
7.909 bln
+1.695 bln
27.27%
Ranking of countries by current statistics by years
About & Feedback
Terms
Privacy
FAQ
Support 24/7
Cabinet
Get premium
Donate
The service accepts bank transfer (ACH, Wire) or cards (Visa, MasterCard, etc). Processed by Stripe.
Secured with SSL