33
/
AIzaSyB4mHJ5NPEv-XzF7P6NDYXjlkCWaeKw5bc
November 30, 2025
196049
Mexico
MEX
true
2
1
PNG, bonds (DOD, current US$)
2016,2015,2014,2013,2012,2011,2010,2009,2008,2007,2006,2005,2004,2003,2002,2001,2000,1999,1998,1997,1996,1995,1994,1993,1992,1991
Create a timeline
Public Timelines
For education
For educational institutions
For teachers
For students
Cabinet
For educational institutions
For teachers
For students
Open cabinet
FAQ
Close
Create a timeline
Public timelines
FAQ
About & Feedback
Terms
Privacy
FAQ
Support 24/7
Cabinet
Get premium
Donate
Download
Global statistics library
→
Mexico
→
PNG, bonds (DOD, current US$)
This statistics in other country:
Argentina
Armenia
Botswana
Brazil
Bulgaria
China
Colombia
Costa Rica
Dominican Republic
East Asia & Pacific (excluding high income)
Ecuador
Egypt, Arab Rep.
El Salvador
Europe & Central Asia (excluding high income)
Georgia
Ghana
Guatemala
IDA only
India
Indonesia
Jamaica
Kazakhstan
Lao PDR
Latin America & Caribbean (excluding high income)
Lebanon
Low & middle income
Lower middle income
Malaysia
Mexico
Middle East & North Africa (excluding high income)
Middle income
Mongolia
Nigeria
Pakistan
Panama
Paraguay
Peru
Philippines
Romania
Russian Federation
Serbia
South Africa
South Asia
Sri Lanka
Sub-Saharan Africa (excluding high income)
Thailand
Turkey
Ukraine
Upper middle income
Venezuela, RB
Vietnam
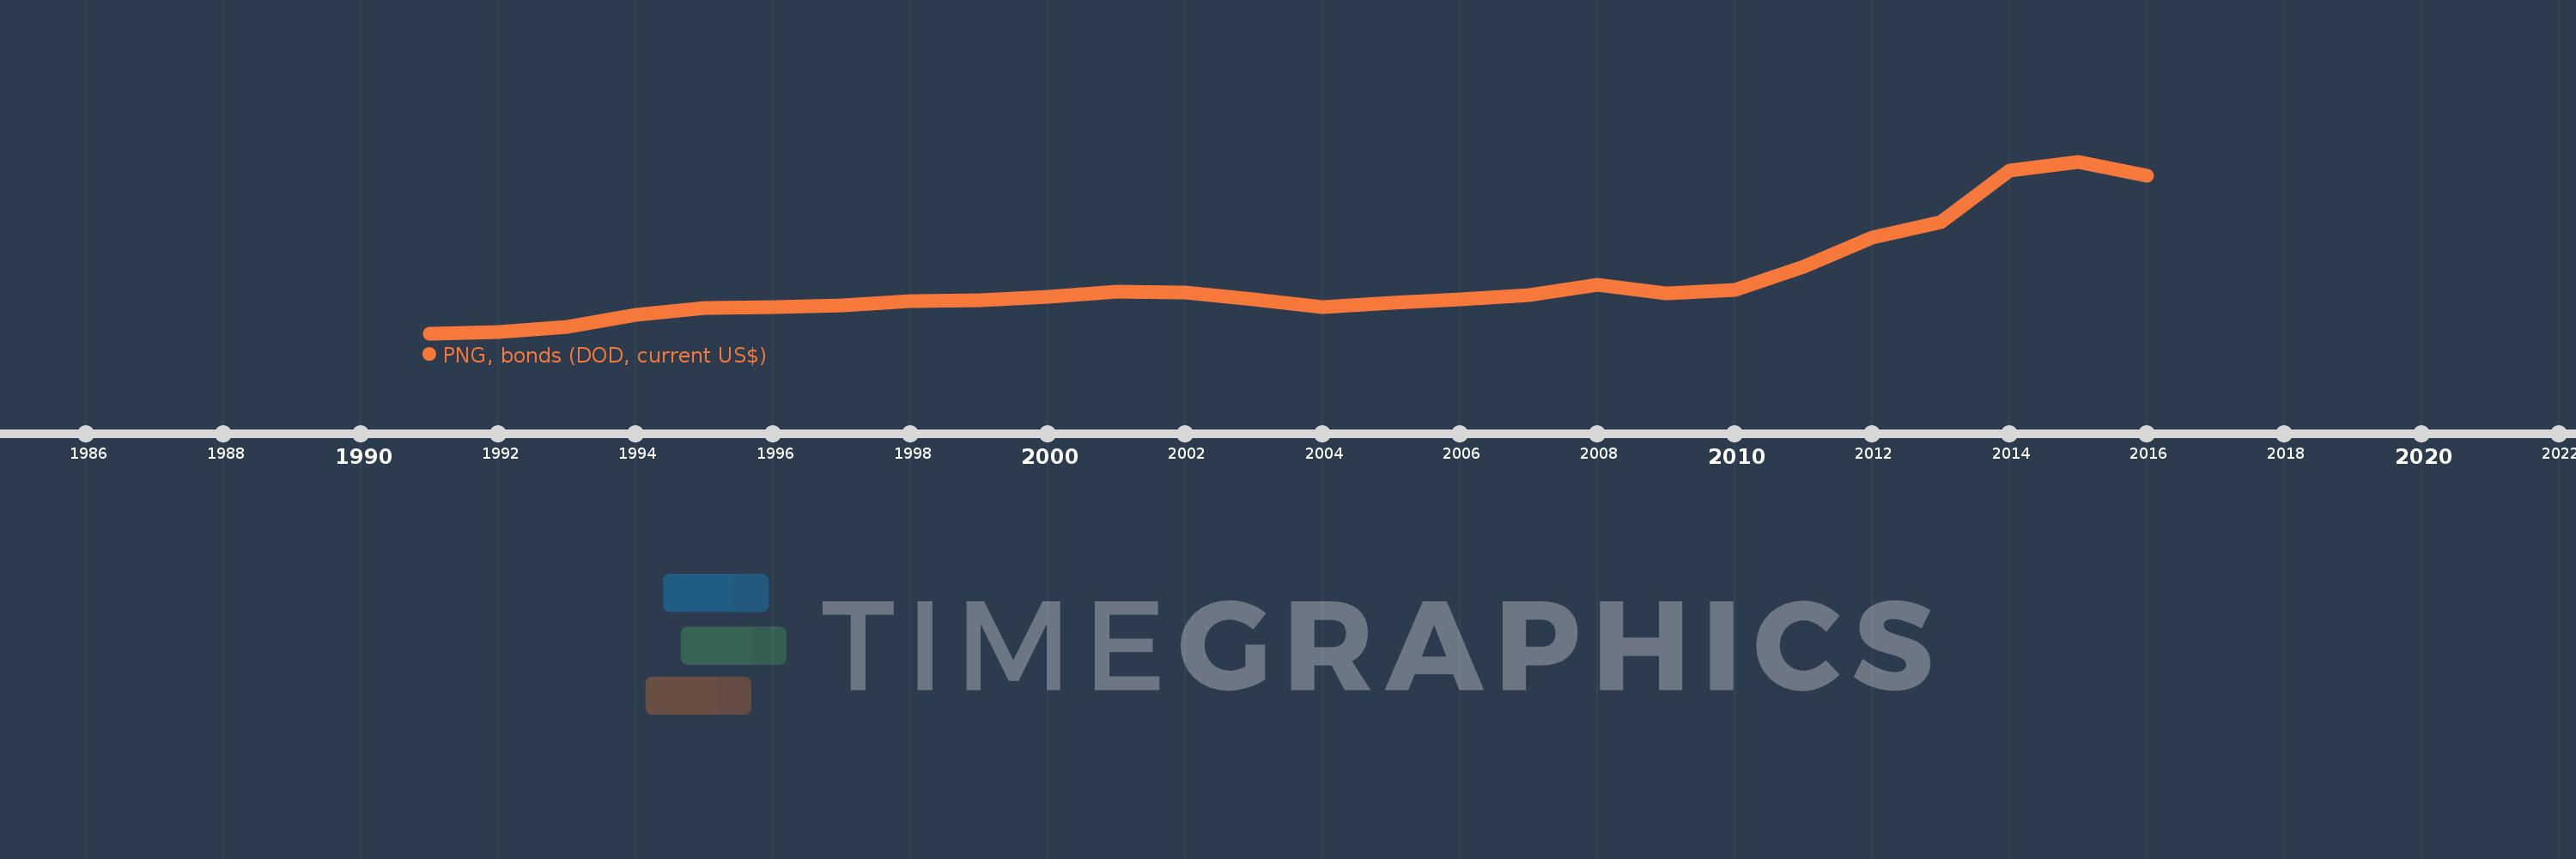
Timeline:
This timeline shows a graph from
1991
to
2016
of Mexico. No data until
1990
. Number of actual observations by date:
26
.
Source name:
World Development Indicators
Source organization:
World Bank, International Debt Statistics.
Categories, topics:
External Debt
Last updated:
apr 23, 2017
Indicators value changes by year
Meaning:
25.723 bln
Minimum:
150.0 mln
jan 1, 1991
Maximum:
84.752 bln
jan 1, 2015
At the date of observation
Value
Absolute change
Change from the previous value
jan 1, 1991
150.0 mln
+150.0 mln
0.0%
jan 1, 1992
702.875 mln
+552.875 mln
368.58%
jan 1, 1993
3.31 bln
+2.607 bln
370.88%
jan 1, 1994
9.127 bln
+5.817 bln
175.75%
jan 1, 1995
12.767 bln
+3.64 bln
39.89%
jan 1, 1996
13.026 bln
+258.837 mln
2.03%
jan 1, 1997
14.104 bln
+1.078 bln
8.28%
jan 1, 1998
15.81 bln
+1.706 bln
12.1%
jan 1, 1999
16.546 bln
+735.435 mln
4.65%
jan 1, 2000
18.157 bln
+1.611 bln
9.74%
jan 1, 2001
20.644 bln
+2.487 bln
13.7%
jan 1, 2002
20.181 bln
-463.003 mln
-2.24%
jan 1, 2003
16.774 bln
-3.407 bln
-16.88%
jan 1, 2004
12.861 bln
-3.912 bln
-23.32%
jan 1, 2005
14.967 bln
+2.106 bln
16.38%
jan 1, 2006
16.943 bln
+1.975 bln
13.2%
jan 1, 2007
18.933 bln
+1.99 bln
11.74%
jan 1, 2008
24.237 bln
+5.304 bln
28.01%
jan 1, 2009
19.848 bln
-4.388 bln
-18.11%
jan 1, 2010
21.444 bln
+1.596 bln
8.04%
jan 1, 2011
32.898 bln
+11.454 bln
53.42%
jan 1, 2012
47.393 bln
+14.495 bln
44.06%
jan 1, 2013
54.967 bln
+7.574 bln
15.98%
jan 1, 2014
80.4 bln
+25.433 bln
46.27%
jan 1, 2015
84.752 bln
+4.352 bln
5.41%
jan 1, 2016
77.863 bln
-6.889 bln
-8.13%
Ranking of countries by current statistics by years
About & Feedback
Terms
Privacy
FAQ
Support 24/7
Cabinet
Get premium
Donate
The service accepts bank transfer (ACH, Wire) or cards (Visa, MasterCard, etc). Processed by Stripe.
Secured with SSL