33
/
AIzaSyB4mHJ5NPEv-XzF7P6NDYXjlkCWaeKw5bc
November 30, 2025
246093
South Africa
ZAF
true
2
1
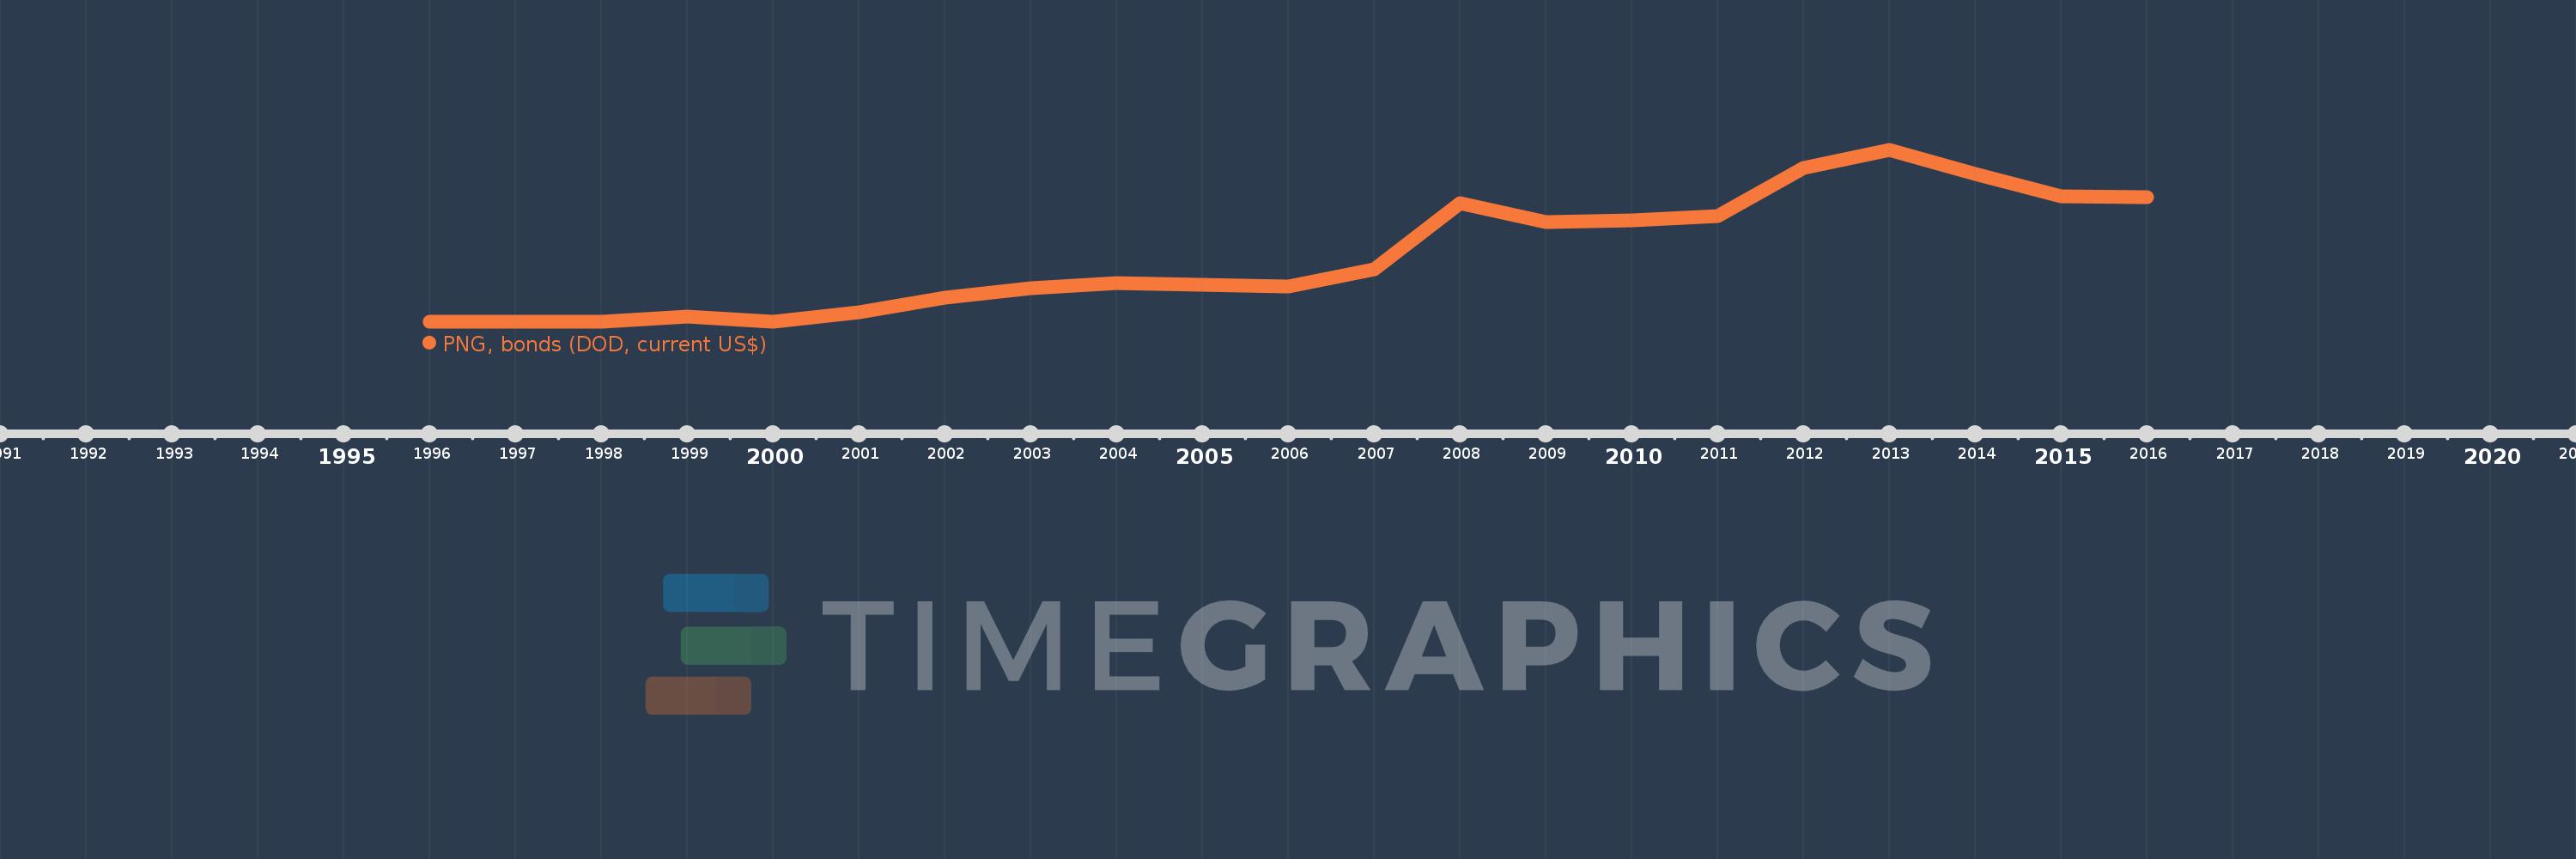
PNG, bonds (DOD, current US$)
2016,2015,2014,2013,2012,2011,2010,2009,2008,2007,2006,2005,2004,2003,2002,2001,2000,1999,1998,1997,1996
Create a timeline
Public Timelines
For education
For educational institutions
For teachers
For students
Cabinet
For educational institutions
For teachers
For students
Open cabinet
FAQ
Close
Create a timeline
Public timelines
FAQ
About & Feedback
Terms
Privacy
FAQ
Support 24/7
Cabinet
Get premium
Donate
Download
Global statistics library
→
South Africa
→
PNG, bonds (DOD, current US$)
This statistics in other country:
Argentina
Armenia
Botswana
Brazil
Bulgaria
China
Colombia
Costa Rica
Dominican Republic
East Asia & Pacific (excluding high income)
Ecuador
Egypt, Arab Rep.
El Salvador
Europe & Central Asia (excluding high income)
Georgia
Ghana
Guatemala
IDA only
India
Indonesia
Jamaica
Kazakhstan
Lao PDR
Latin America & Caribbean (excluding high income)
Lebanon
Low & middle income
Lower middle income
Malaysia
Mexico
Middle East & North Africa (excluding high income)
Middle income
Mongolia
Nigeria
Pakistan
Panama
Paraguay
Peru
Philippines
Romania
Russian Federation
Serbia
South Africa
South Asia
Sri Lanka
Sub-Saharan Africa (excluding high income)
Thailand
Turkey
Ukraine
Upper middle income
Venezuela, RB
Vietnam
Timeline:
This timeline shows a graph from
1996
to
2016
of South Africa. No data until
1995
. Number of actual observations by date:
21
.
Source name:
World Development Indicators
Source organization:
World Bank, International Debt Statistics.
Categories, topics:
External Debt
Last updated:
apr 23, 2017
Indicators value changes by year
Meaning:
5.627 bln
Minimum:
350.0 mln
jan 1, 1996
Maximum:
14.069 bln
jan 1, 2013
At the date of observation
Value
Absolute change
Change from the previous value
jan 1, 1996
350.0 mln
+350.0 mln
0.0%
jan 1, 1997
350.0 mln
0.0
0.0%
jan 1, 1998
395.0 mln
+45.0 mln
12.86%
jan 1, 1999
786.254 mln
+391.254 mln
99.05%
jan 1, 2000
395.0 mln
-391.254 mln
-49.76%
jan 1, 2001
1.11 bln
+715.25 mln
181.08%
jan 1, 2002
2.307 bln
+1.196 bln
107.75%
jan 1, 2003
3.066 bln
+759.45 mln
32.93%
jan 1, 2004
3.435 bln
+369.0 mln
12.04%
jan 1, 2005
3.286 bln
-149.0 mln
-4.34%
jan 1, 2006
3.196 bln
-90.0 mln
-2.74%
jan 1, 2007
4.535 bln
+1.339 bln
41.9%
jan 1, 2008
9.835 bln
+5.3 bln
116.87%
jan 1, 2009
8.322 bln
-1.513 bln
-15.38%
jan 1, 2010
8.485 bln
+163.0 mln
1.96%
jan 1, 2011
8.786 bln
+301.0 mln
3.55%
jan 1, 2012
12.638 bln
+3.852 bln
43.84%
jan 1, 2013
14.069 bln
+1.431 bln
11.32%
jan 1, 2014
12.152 bln
-1.917 bln
-13.63%
jan 1, 2015
10.366 bln
-1.786 bln
-14.7%
jan 1, 2016
10.309 bln
-56.916 mln
-0.55%
Ranking of countries by current statistics by years
About & Feedback
Terms
Privacy
FAQ
Support 24/7
Cabinet
Get premium
Donate
The service accepts bank transfer (ACH, Wire) or cards (Visa, MasterCard, etc). Processed by Stripe.
Secured with SSL