Download This statistics in other country:
Timeline:
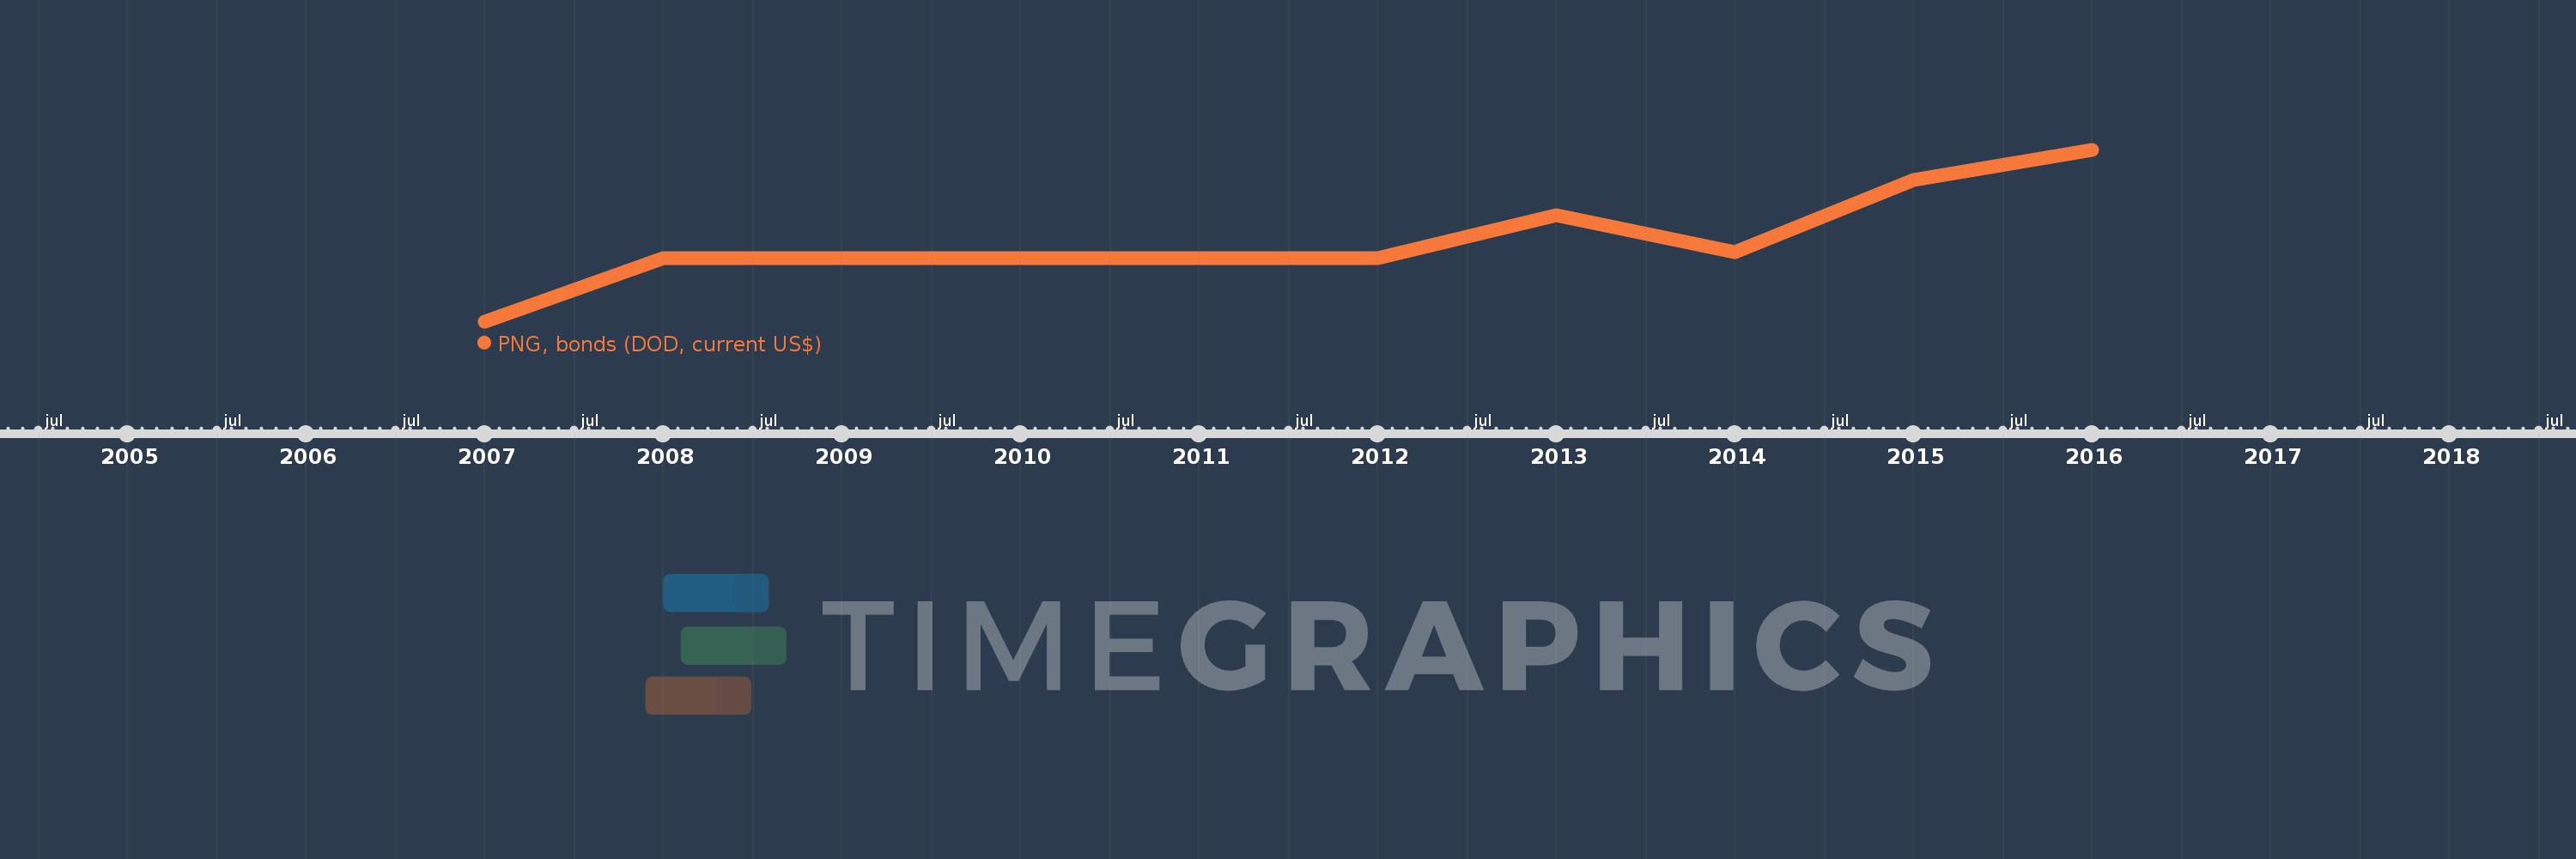
This timeline shows a graph from 2007 to 2016 of Dominican Republic. No data until 2006. Number of actual observations by date: 10.
Source name:
World Development Indicators
Source organization:
World Bank, International Debt Statistics.
Categories, topics:
External Debt
Last updated:
apr 23, 2017
Indicators value changes by year
Minimum:
412.0 mln
jan 1, 2007
Maximum:
1.575 bln
jan 1, 2016
At the date of observation
Value
Absolute change
Change from the previous value
jan 1, 2007
412.0 mln
+412.0 mln
0.0%
jan 1, 2008
843.908 mln
+431.908 mln
104.83%
jan 1, 2009
842.623 mln
-1.285 mln
-0.15%
jan 1, 2010
842.623 mln
0.0
0.0%
jan 1, 2011
842.623 mln
0.0
0.0%
jan 1, 2012
842.623 mln
0.0
0.0%
jan 1, 2013
1.137 bln
+294.377 mln
34.94%
jan 1, 2014
887.0 mln
-250.0 mln
-21.99%
jan 1, 2015
1.375 bln
+488.35 mln
55.06%
jan 1, 2016
1.575 bln
+200.0 mln
14.54%
Ranking of countries by current statistics by years