33
/
AIzaSyB4mHJ5NPEv-XzF7P6NDYXjlkCWaeKw5bc
November 30, 2025
281467
Venezuela, RB
VEN
true
2
1
PNG, bonds (DOD, current US$)
2016,2015,2014,2013,2012,2011,2010,2009,2008,2007,2006,2005,2004,2003,2002,2001,2000,1999,1998,1997,1996,1995,1994,1993
Create a timeline
Public Timelines
For education
For educational institutions
For teachers
For students
Cabinet
For educational institutions
For teachers
For students
Open cabinet
FAQ
Close
Create a timeline
Public timelines
FAQ
About & Feedback
Terms
Privacy
FAQ
Support 24/7
Cabinet
Get premium
Donate
Download
Global statistics library
→
Venezuela, RB
→
PNG, bonds (DOD, current US$)
This statistics in other country:
Argentina
Armenia
Botswana
Brazil
Bulgaria
China
Colombia
Costa Rica
Dominican Republic
East Asia & Pacific (excluding high income)
Ecuador
Egypt, Arab Rep.
El Salvador
Europe & Central Asia (excluding high income)
Georgia
Ghana
Guatemala
IDA only
India
Indonesia
Jamaica
Kazakhstan
Lao PDR
Latin America & Caribbean (excluding high income)
Lebanon
Low & middle income
Lower middle income
Malaysia
Mexico
Middle East & North Africa (excluding high income)
Middle income
Mongolia
Nigeria
Pakistan
Panama
Paraguay
Peru
Philippines
Romania
Russian Federation
Serbia
South Africa
South Asia
Sri Lanka
Sub-Saharan Africa (excluding high income)
Thailand
Turkey
Ukraine
Upper middle income
Venezuela, RB
Vietnam
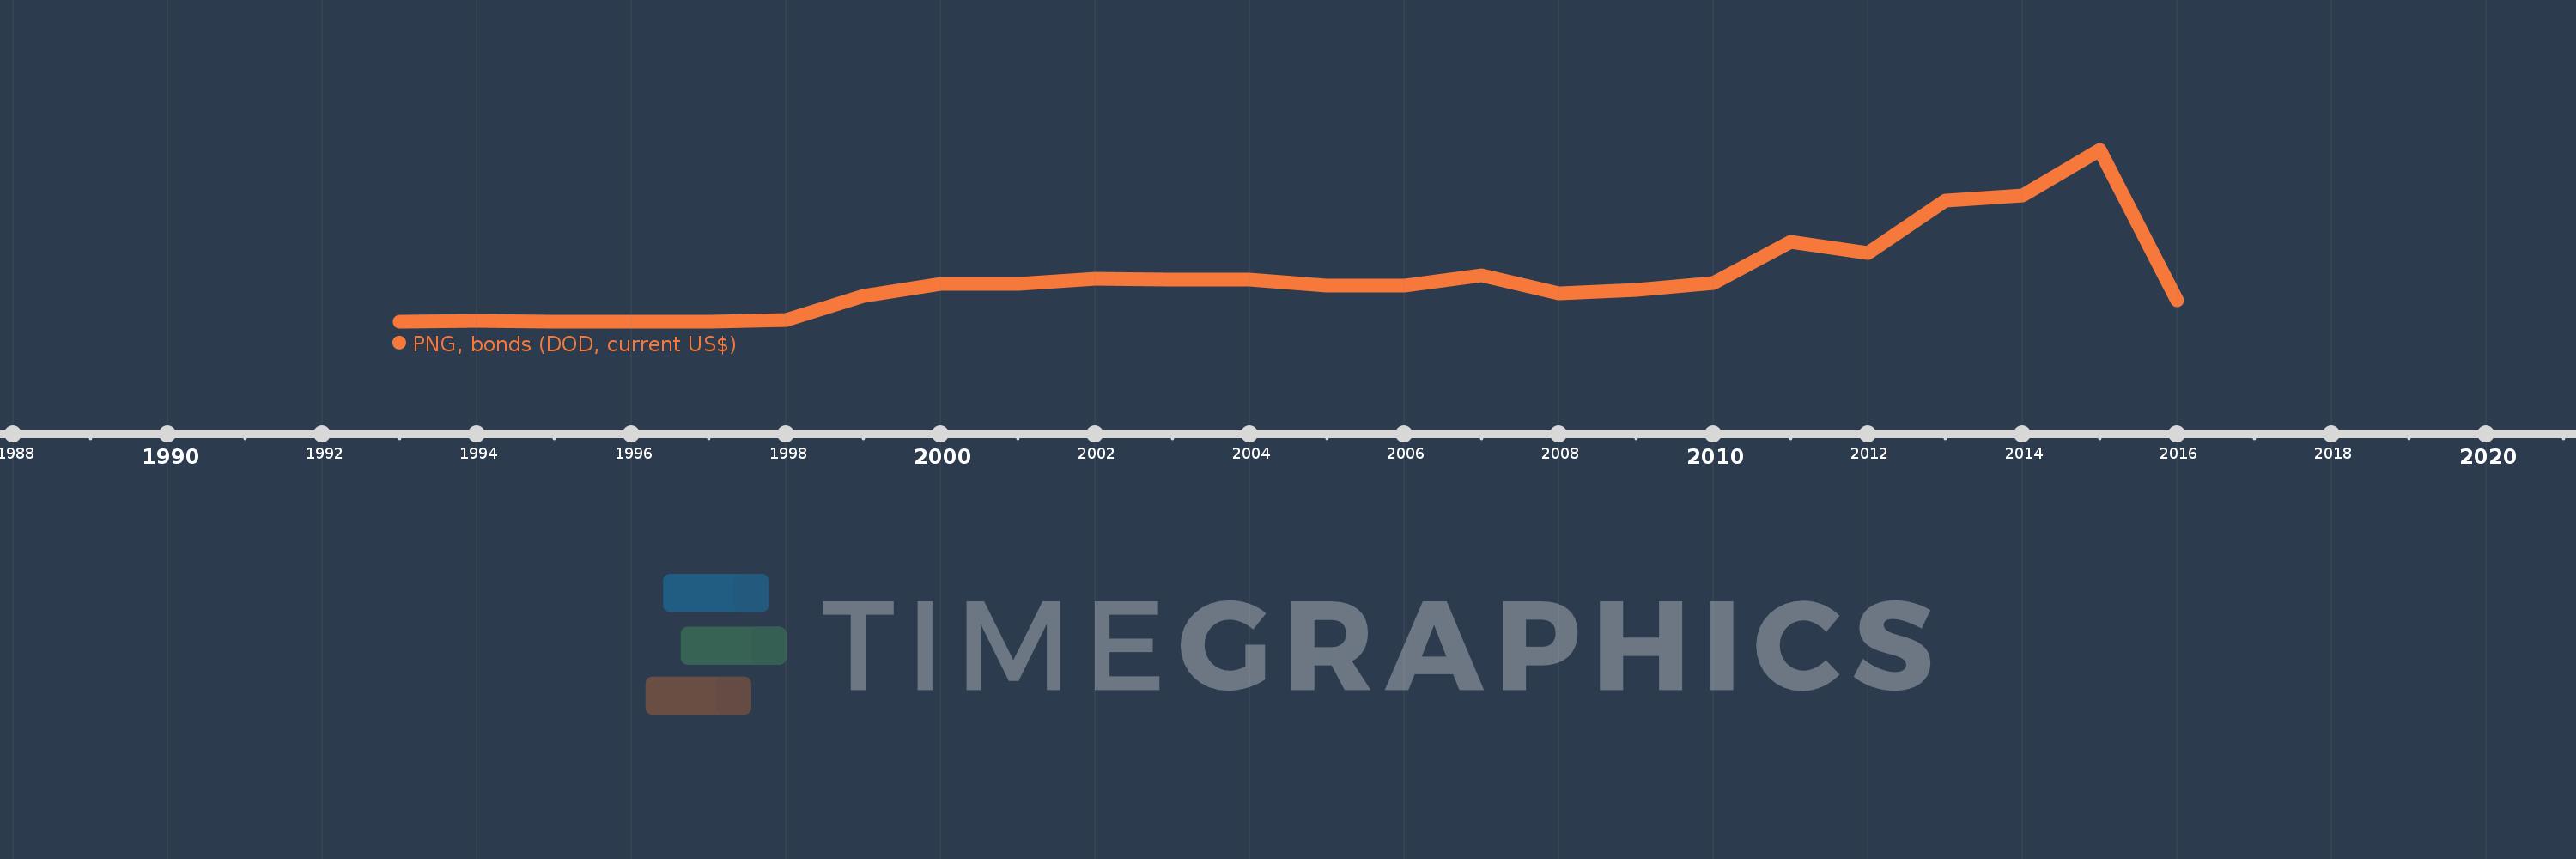
Timeline:
This timeline shows a graph from
1993
to
2016
of Venezuela, RB. No data until
1992
. Number of actual observations by date:
24
.
Source name:
World Development Indicators
Source organization:
World Bank, International Debt Statistics.
Categories, topics:
External Debt
Last updated:
apr 23, 2017
Indicators value changes by year
Meaning:
4.416 bln
Minimum:
114.0 mln
jan 1, 1995
Maximum:
17.08 bln
jan 1, 2015
At the date of observation
Value
Absolute change
Change from the previous value
jan 1, 1993
174.0 mln
+174.0 mln
0.0%
jan 1, 1994
264.0 mln
+90.0 mln
51.72%
jan 1, 1995
114.0 mln
-150.0 mln
-56.82%
jan 1, 1996
114.0 mln
0.0
0.0%
jan 1, 1997
134.0 mln
+20.0 mln
17.54%
jan 1, 1998
319.0 mln
+185.0 mln
138.06%
jan 1, 1999
2.694 bln
+2.375 bln
744.51%
jan 1, 2000
3.895 bln
+1.201 bln
44.58%
jan 1, 2001
3.88 bln
-14.82 mln
-0.38%
jan 1, 2002
4.357 bln
+476.52 mln
12.28%
jan 1, 2003
4.271 bln
-85.42 mln
-1.96%
jan 1, 2004
4.327 bln
+55.4 mln
1.3%
jan 1, 2005
3.682 bln
-644.42 mln
-14.89%
jan 1, 2006
3.67 bln
-12.24 mln
-0.33%
jan 1, 2007
4.734 bln
+1.064 bln
28.99%
jan 1, 2008
2.96 bln
-1.774 bln
-37.47%
jan 1, 2009
3.31 bln
+350.0 mln
11.82%
jan 1, 2010
3.972 bln
+662.48 mln
20.01%
jan 1, 2011
8.067 bln
+4.094 bln
103.07%
jan 1, 2012
6.942 bln
-1.125 bln
-13.95%
jan 1, 2013
12.11 bln
+5.168 bln
74.45%
jan 1, 2014
12.626 bln
+515.681 mln
4.26%
jan 1, 2015
17.08 bln
+4.455 bln
35.28%
jan 1, 2016
2.3 bln
-14.78 bln
-86.53%
Ranking of countries by current statistics by years
About & Feedback
Terms
Privacy
FAQ
Support 24/7
Cabinet
Get premium
Donate
The service accepts bank transfer (ACH, Wire) or cards (Visa, MasterCard, etc). Processed by Stripe.
Secured with SSL