33
/
AIzaSyB4mHJ5NPEv-XzF7P6NDYXjlkCWaeKw5bc
November 30, 2025
176879
Lebanon
LBN
true
2
1
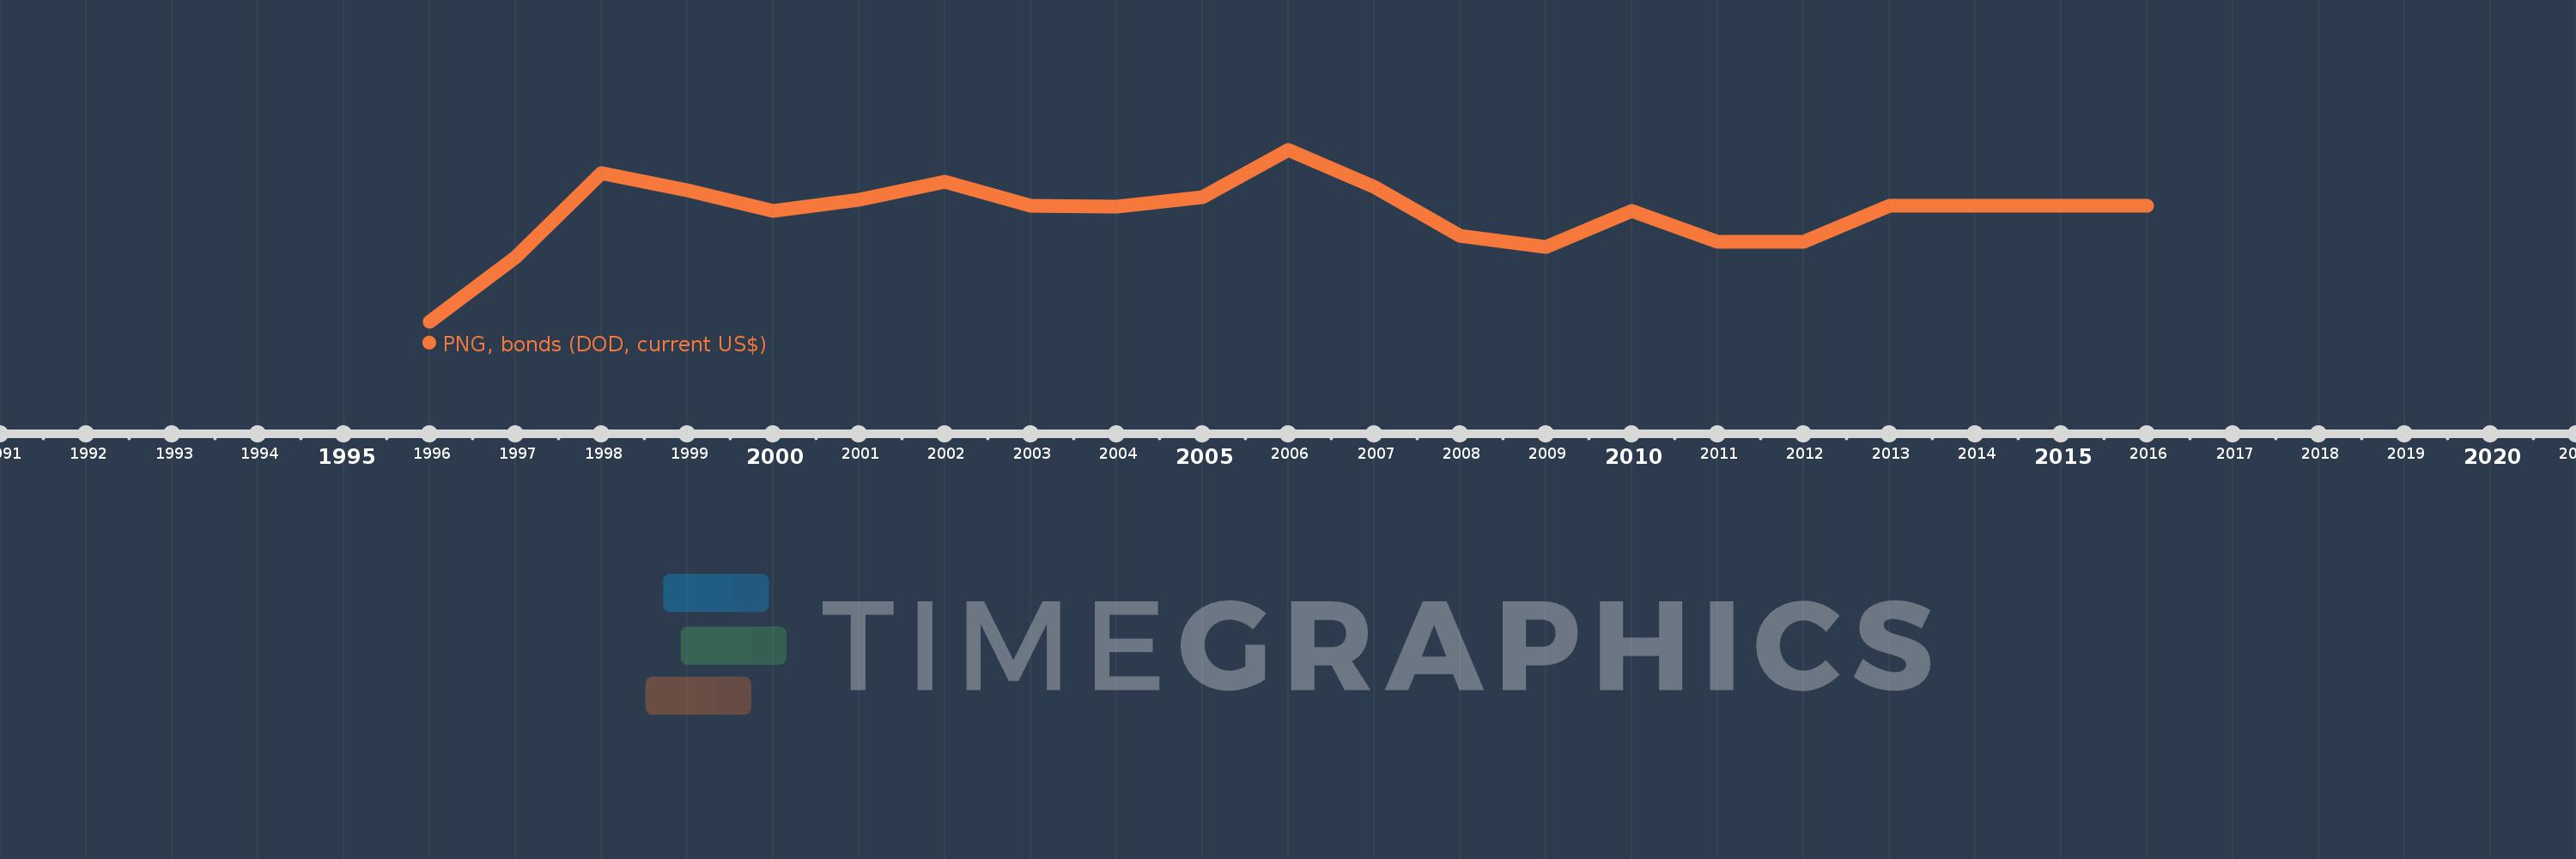
PNG, bonds (DOD, current US$)
2016,2015,2014,2013,2012,2011,2010,2009,2008,2007,2006,2005,2004,2003,2002,2001,2000,1999,1998,1997,1996
Create a timeline
Public Timelines
For education
For educational institutions
For teachers
For students
Cabinet
For educational institutions
For teachers
For students
Open cabinet
FAQ
Close
Create a timeline
Public timelines
FAQ
About & Feedback
Terms
Privacy
FAQ
Support 24/7
Cabinet
Get premium
Donate
Download
Global statistics library
→
Lebanon
→
PNG, bonds (DOD, current US$)
This statistics in other country:
Argentina
Armenia
Botswana
Brazil
Bulgaria
China
Colombia
Costa Rica
Dominican Republic
East Asia & Pacific (excluding high income)
Ecuador
Egypt, Arab Rep.
El Salvador
Europe & Central Asia (excluding high income)
Georgia
Ghana
Guatemala
IDA only
India
Indonesia
Jamaica
Kazakhstan
Lao PDR
Latin America & Caribbean (excluding high income)
Lebanon
Low & middle income
Lower middle income
Malaysia
Mexico
Middle East & North Africa (excluding high income)
Middle income
Mongolia
Nigeria
Pakistan
Panama
Paraguay
Peru
Philippines
Romania
Russian Federation
Serbia
South Africa
South Asia
Sri Lanka
Sub-Saharan Africa (excluding high income)
Thailand
Turkey
Ukraine
Upper middle income
Venezuela, RB
Vietnam
Timeline:
This timeline shows a graph from
1996
to
2016
of Lebanon. No data until
1995
. Number of actual observations by date:
21
.
Source name:
World Development Indicators
Source organization:
World Bank, International Debt Statistics.
Categories, topics:
External Debt
Last updated:
apr 23, 2017
Indicators value changes by year
Meaning:
657.238 mln
Minimum:
50.0 mln
jan 1, 1996
Maximum:
1.011 bln
jan 1, 2006
At the date of observation
Value
Absolute change
Change from the previous value
jan 1, 1996
50.0 mln
+50.0 mln
0.0%
jan 1, 1997
410.0 mln
+360.0 mln
720.0%
jan 1, 1998
885.0 mln
+475.0 mln
115.85%
jan 1, 1999
785.0 mln
-100.0 mln
-11.3%
jan 1, 2000
671.0 mln
-114.0 mln
-14.52%
jan 1, 2001
736.0 mln
+65.0 mln
9.69%
jan 1, 2002
836.0 mln
+100.0 mln
13.59%
jan 1, 2003
701.0 mln
-135.0 mln
-16.15%
jan 1, 2004
696.0 mln
-5.0 mln
-0.71%
jan 1, 2005
746.0 mln
+50.0 mln
7.18%
jan 1, 2006
1.011 bln
+265.0 mln
35.52%
jan 1, 2007
805.0 mln
-206.0 mln
-20.38%
jan 1, 2008
530.0 mln
-275.0 mln
-34.16%
jan 1, 2009
470.0 mln
-60.0 mln
-11.32%
jan 1, 2010
670.0 mln
+200.0 mln
42.55%
jan 1, 2011
500.0 mln
-170.0 mln
-25.37%
jan 1, 2012
500.0 mln
0.0
0.0%
jan 1, 2013
700.0 mln
+200.0 mln
40.0%
jan 1, 2014
700.0 mln
0.0
0.0%
jan 1, 2015
700.0 mln
0.0
0.0%
jan 1, 2016
700.0 mln
0.0
0.0%
Ranking of countries by current statistics by years
About & Feedback
Terms
Privacy
FAQ
Support 24/7
Cabinet
Get premium
Donate
The service accepts bank transfer (ACH, Wire) or cards (Visa, MasterCard, etc). Processed by Stripe.
Secured with SSL