33
/
AIzaSyB4mHJ5NPEv-XzF7P6NDYXjlkCWaeKw5bc
November 30, 2025
230225
Russian Federation
RUS
true
2
1
PNG, bonds (DOD, current US$)
2016,2015,2014,2013,2012,2011,2010,2009,2008,2007,2006,2005,2004,2003,2002,2001,2000,1999,1998
Create a timeline
Public Timelines
For education
For educational institutions
For teachers
For students
Cabinet
For educational institutions
For teachers
For students
Open cabinet
FAQ
Close
Create a timeline
Public timelines
FAQ
About & Feedback
Terms
Privacy
FAQ
Support 24/7
Cabinet
Get premium
Donate
Download
Global statistics library
→
Russian Federation
→
PNG, bonds (DOD, current US$)
This statistics in other country:
Argentina
Armenia
Botswana
Brazil
Bulgaria
China
Colombia
Costa Rica
Dominican Republic
East Asia & Pacific (excluding high income)
Ecuador
Egypt, Arab Rep.
El Salvador
Europe & Central Asia (excluding high income)
Georgia
Ghana
Guatemala
IDA only
India
Indonesia
Jamaica
Kazakhstan
Lao PDR
Latin America & Caribbean (excluding high income)
Lebanon
Low & middle income
Lower middle income
Malaysia
Mexico
Middle East & North Africa (excluding high income)
Middle income
Mongolia
Nigeria
Pakistan
Panama
Paraguay
Peru
Philippines
Romania
Russian Federation
Serbia
South Africa
South Asia
Sri Lanka
Sub-Saharan Africa (excluding high income)
Thailand
Turkey
Ukraine
Upper middle income
Venezuela, RB
Vietnam
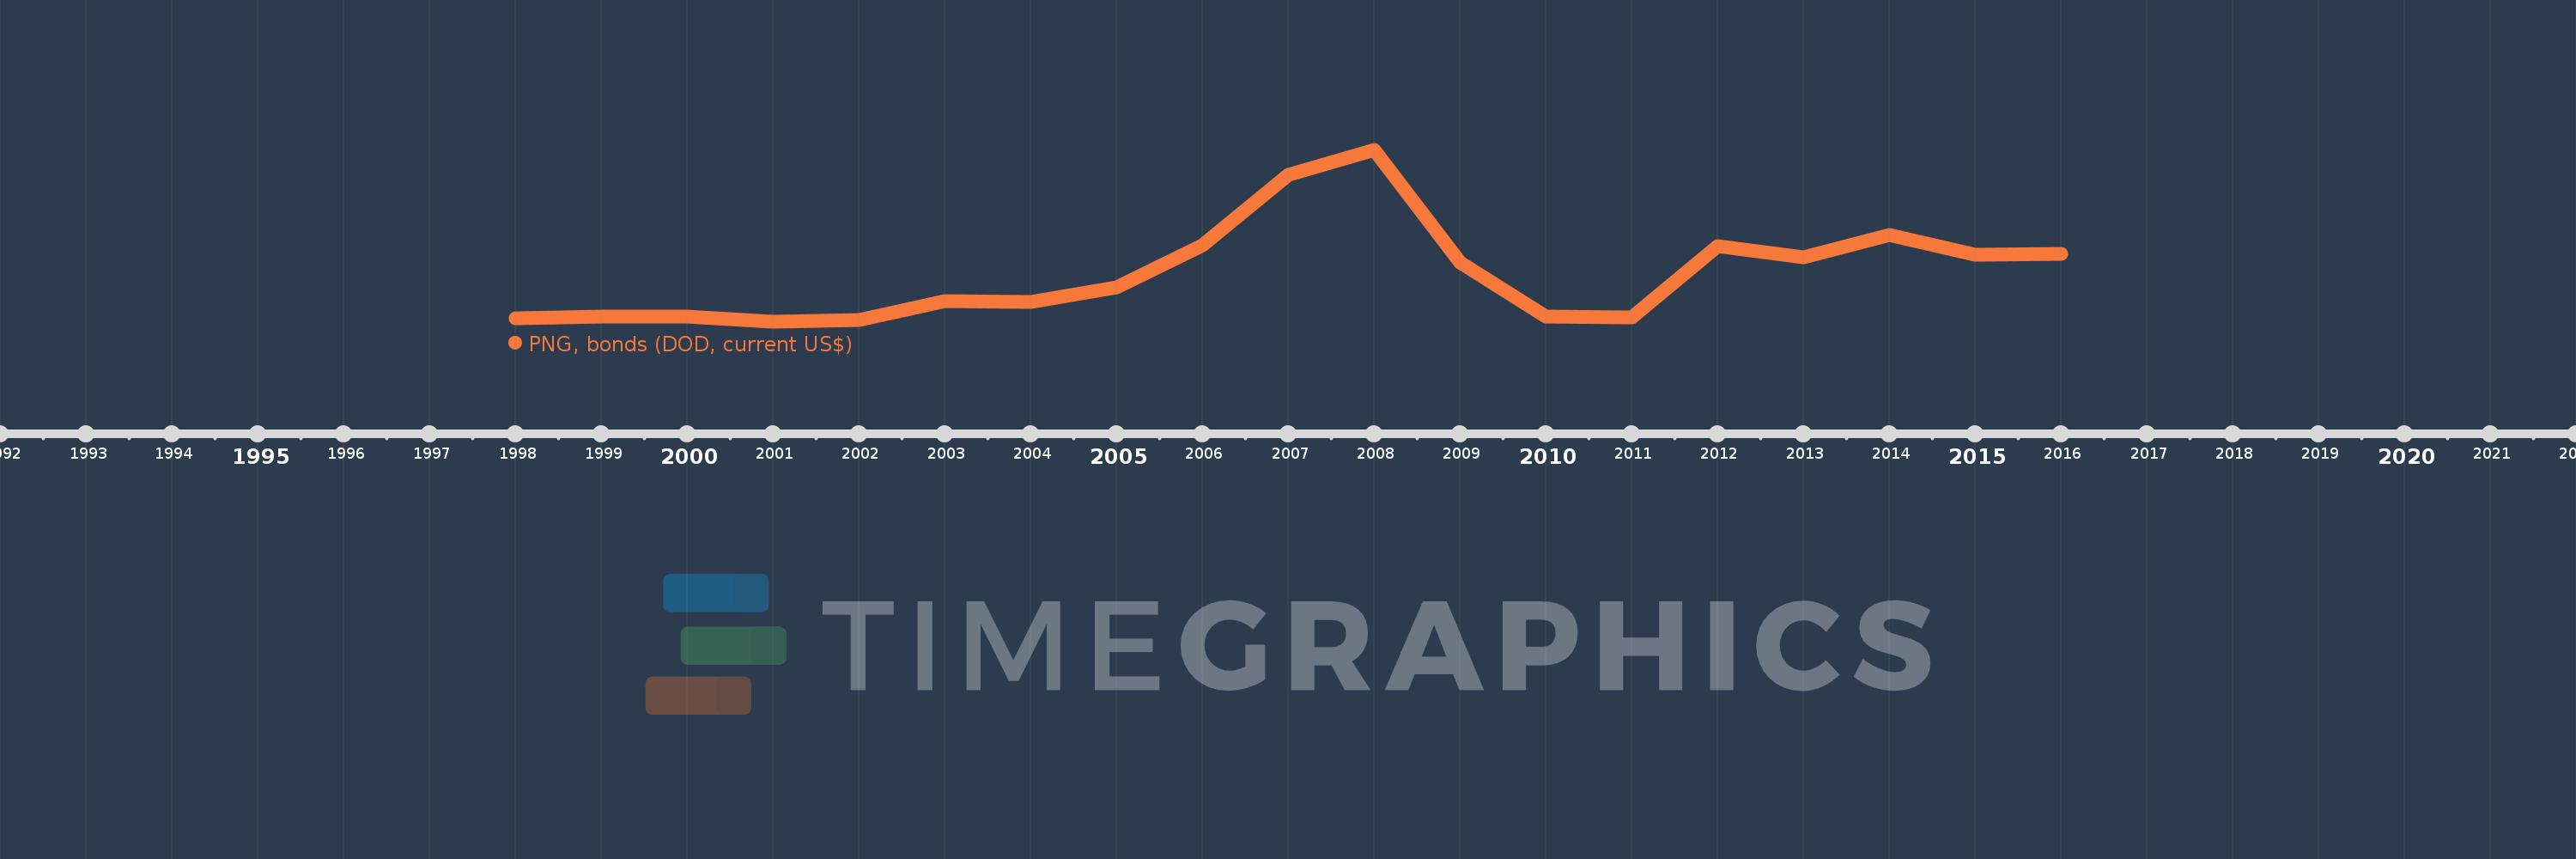
Timeline:
This timeline shows a graph from
1998
to
2016
of Russian Federation. No data until
1997
. Number of actual observations by date:
19
.
Source name:
World Development Indicators
Source organization:
World Bank, International Debt Statistics.
Categories, topics:
External Debt
Last updated:
apr 23, 2017
Indicators value changes by year
Meaning:
8.67 bln
Minimum:
1.412 bln
jan 1, 2001
Maximum:
27.166 bln
jan 1, 2008
At the date of observation
Value
Absolute change
Change from the previous value
jan 1, 1998
1.905 bln
+1.905 bln
0.0%
jan 1, 1999
2.189 bln
+284.489 mln
14.93%
jan 1, 2000
2.171 bln
-18.919 mln
-0.86%
jan 1, 2001
1.412 bln
-758.525 mln
-34.95%
jan 1, 2002
1.734 bln
+322.261 mln
22.82%
jan 1, 2003
4.526 bln
+2.791 bln
160.94%
jan 1, 2004
4.467 bln
-58.213 mln
-1.29%
jan 1, 2005
6.552 bln
+2.085 bln
46.67%
jan 1, 2006
12.956 bln
+6.404 bln
97.74%
jan 1, 2007
23.521 bln
+10.565 bln
81.54%
jan 1, 2008
27.166 bln
+3.645 bln
15.5%
jan 1, 2009
10.32 bln
-16.846 bln
-62.01%
jan 1, 2010
2.286 bln
-8.034 bln
-77.85%
jan 1, 2011
2.1 bln
-185.859 mln
-8.13%
jan 1, 2012
12.792 bln
+10.692 bln
509.15%
jan 1, 2013
11.092 bln
-1.7 bln
-13.29%
jan 1, 2014
14.407 bln
+3.315 bln
29.89%
jan 1, 2015
11.492 bln
-2.915 bln
-20.23%
jan 1, 2016
11.639 bln
+146.787 mln
1.28%
Ranking of countries by current statistics by years
About & Feedback
Terms
Privacy
FAQ
Support 24/7
Cabinet
Get premium
Donate
The service accepts bank transfer (ACH, Wire) or cards (Visa, MasterCard, etc). Processed by Stripe.
Secured with SSL