33
/
AIzaSyB4mHJ5NPEv-XzF7P6NDYXjlkCWaeKw5bc
November 30, 2025
224072
Philippines
PHL
true
2
1
PNG, bonds (DOD, current US$)
2016,2015,2014,2013,2012,2011,2010,2009,2008,2007,2006,2005,2004,2003,2002,2001,2000,1999,1998,1997,1996,1995,1994,1993
Create a timeline
Public Timelines
For education
For educational institutions
For teachers
For students
Cabinet
For educational institutions
For teachers
For students
Open cabinet
FAQ
Close
Create a timeline
Public timelines
FAQ
About & Feedback
Terms
Privacy
FAQ
Support 24/7
Cabinet
Get premium
Donate
Download
Global statistics library
→
Philippines
→
PNG, bonds (DOD, current US$)
This statistics in other country:
Argentina
Armenia
Botswana
Brazil
Bulgaria
China
Colombia
Costa Rica
Dominican Republic
East Asia & Pacific (excluding high income)
Ecuador
Egypt, Arab Rep.
El Salvador
Europe & Central Asia (excluding high income)
Georgia
Ghana
Guatemala
IDA only
India
Indonesia
Jamaica
Kazakhstan
Lao PDR
Latin America & Caribbean (excluding high income)
Lebanon
Low & middle income
Lower middle income
Malaysia
Mexico
Middle East & North Africa (excluding high income)
Middle income
Mongolia
Nigeria
Pakistan
Panama
Paraguay
Peru
Philippines
Romania
Russian Federation
Serbia
South Africa
South Asia
Sri Lanka
Sub-Saharan Africa (excluding high income)
Thailand
Turkey
Ukraine
Upper middle income
Venezuela, RB
Vietnam
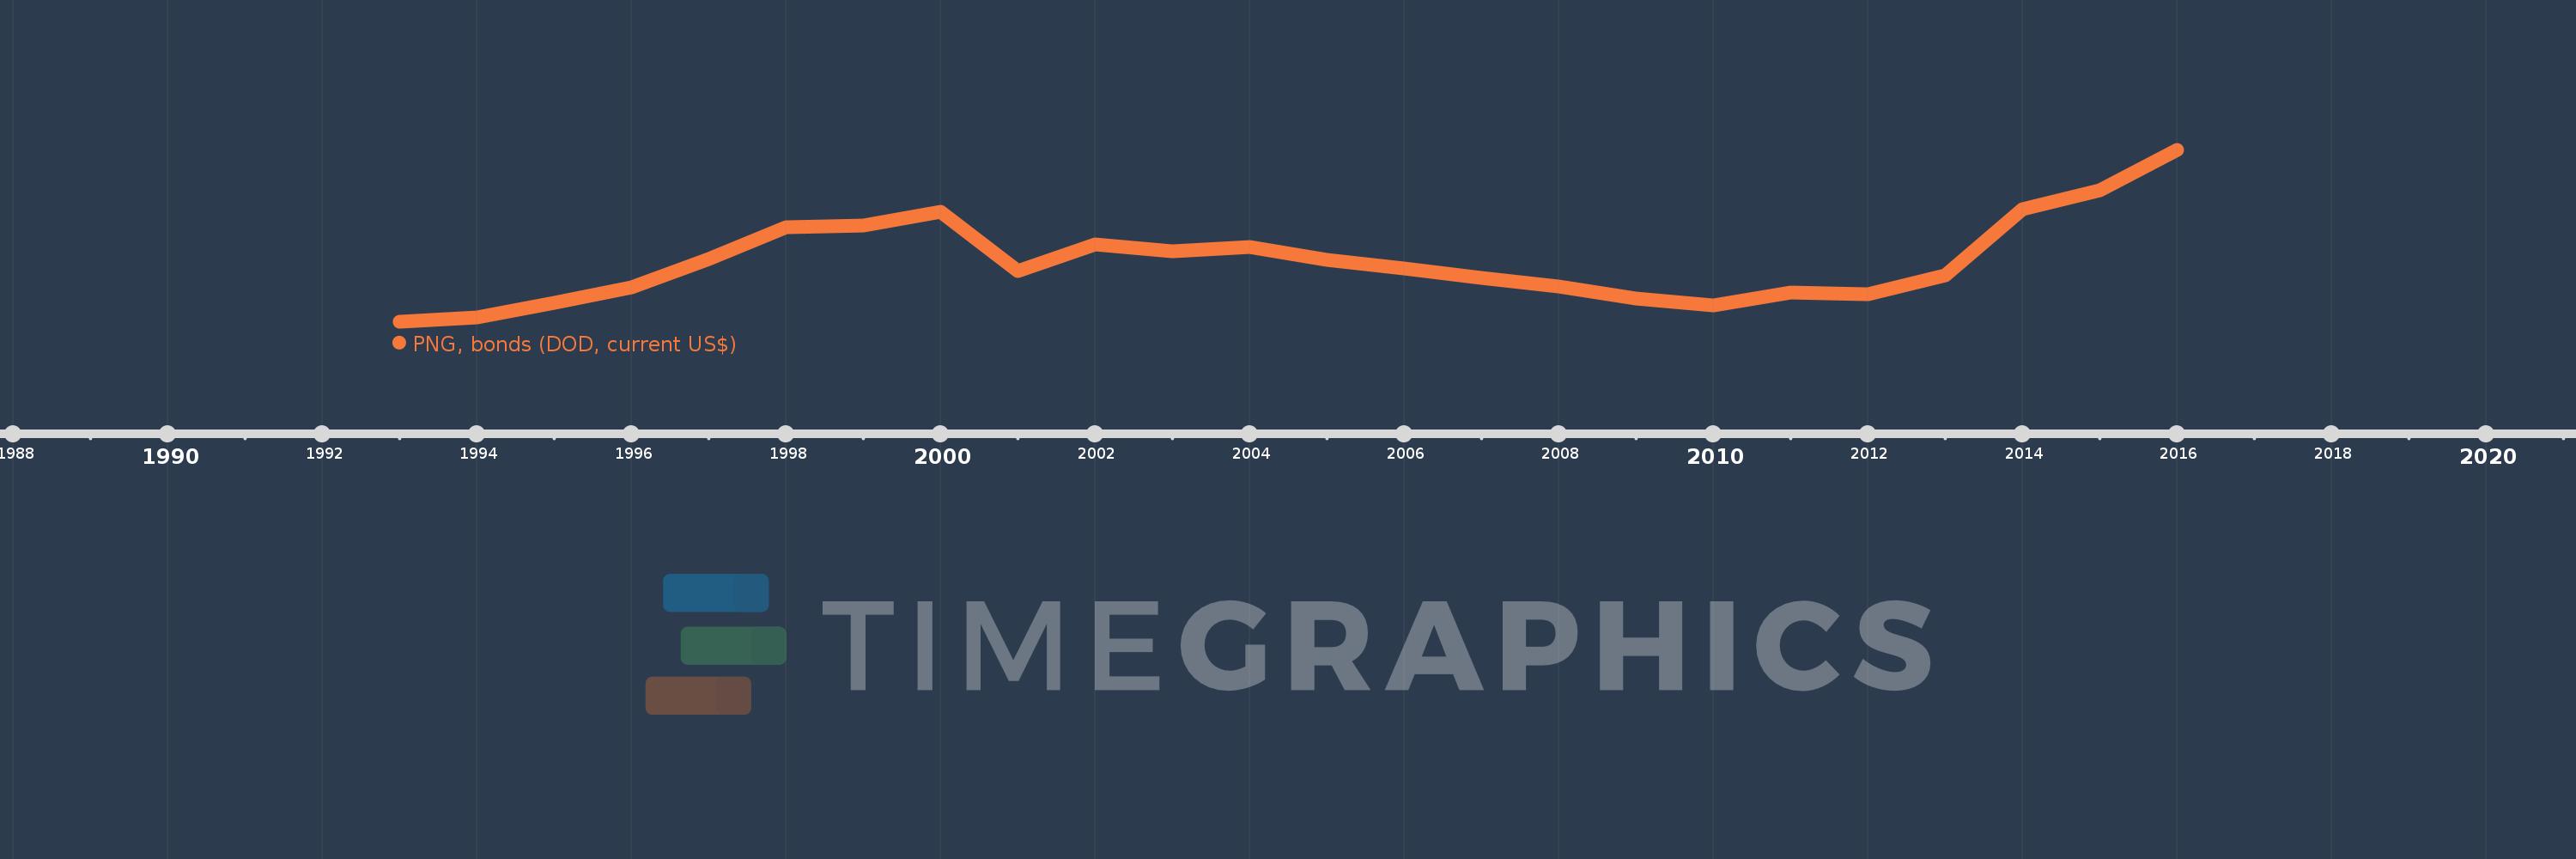
Timeline:
This timeline shows a graph from
1993
to
2016
of Philippines. No data until
1992
. Number of actual observations by date:
24
.
Source name:
World Development Indicators
Source organization:
World Bank, International Debt Statistics.
Categories, topics:
External Debt
Last updated:
apr 23, 2017
Indicators value changes by year
Meaning:
3.372 bln
Minimum:
20.0 mln
jan 1, 1993
Maximum:
9.537 bln
jan 1, 2016
At the date of observation
Value
Absolute change
Change from the previous value
jan 1, 1993
20.0 mln
+20.0 mln
0.0%
jan 1, 1994
270.128 mln
+250.128 mln
1.25K%
jan 1, 1995
1.062 bln
+791.438 mln
292.99%
jan 1, 1996
1.925 bln
+863.194 mln
81.31%
jan 1, 1997
3.499 bln
+1.574 bln
81.78%
jan 1, 1998
5.274 bln
+1.775 bln
50.73%
jan 1, 1999
5.366 bln
+91.913 mln
1.74%
jan 1, 2000
6.137 bln
+770.965 mln
14.37%
jan 1, 2001
2.856 bln
-3.281 bln
-53.46%
jan 1, 2002
4.328 bln
+1.472 bln
51.55%
jan 1, 2003
3.92 bln
-408.26 mln
-9.43%
jan 1, 2004
4.154 bln
+234.461 mln
5.98%
jan 1, 2005
3.465 bln
-689.808 mln
-16.6%
jan 1, 2006
2.975 bln
-489.427 mln
-14.13%
jan 1, 2007
2.476 bln
-499.158 mln
-16.78%
jan 1, 2008
1.993 bln
-483.409 mln
-19.52%
jan 1, 2009
1.314 bln
-678.591 mln
-34.06%
jan 1, 2010
956.0 mln
-358.0 mln
-27.25%
jan 1, 2011
1.651 bln
+695.0 mln
72.7%
jan 1, 2012
1.579 bln
-72.0 mln
-4.36%
jan 1, 2013
2.6 bln
+1.021 bln
64.66%
jan 1, 2014
6.25 bln
+3.65 bln
140.38%
jan 1, 2015
7.325 bln
+1.075 bln
17.2%
jan 1, 2016
9.537 bln
+2.212 bln
30.2%
Ranking of countries by current statistics by years
About & Feedback
Terms
Privacy
FAQ
Support 24/7
Cabinet
Get premium
Donate
The service accepts bank transfer (ACH, Wire) or cards (Visa, MasterCard, etc). Processed by Stripe.
Secured with SSL