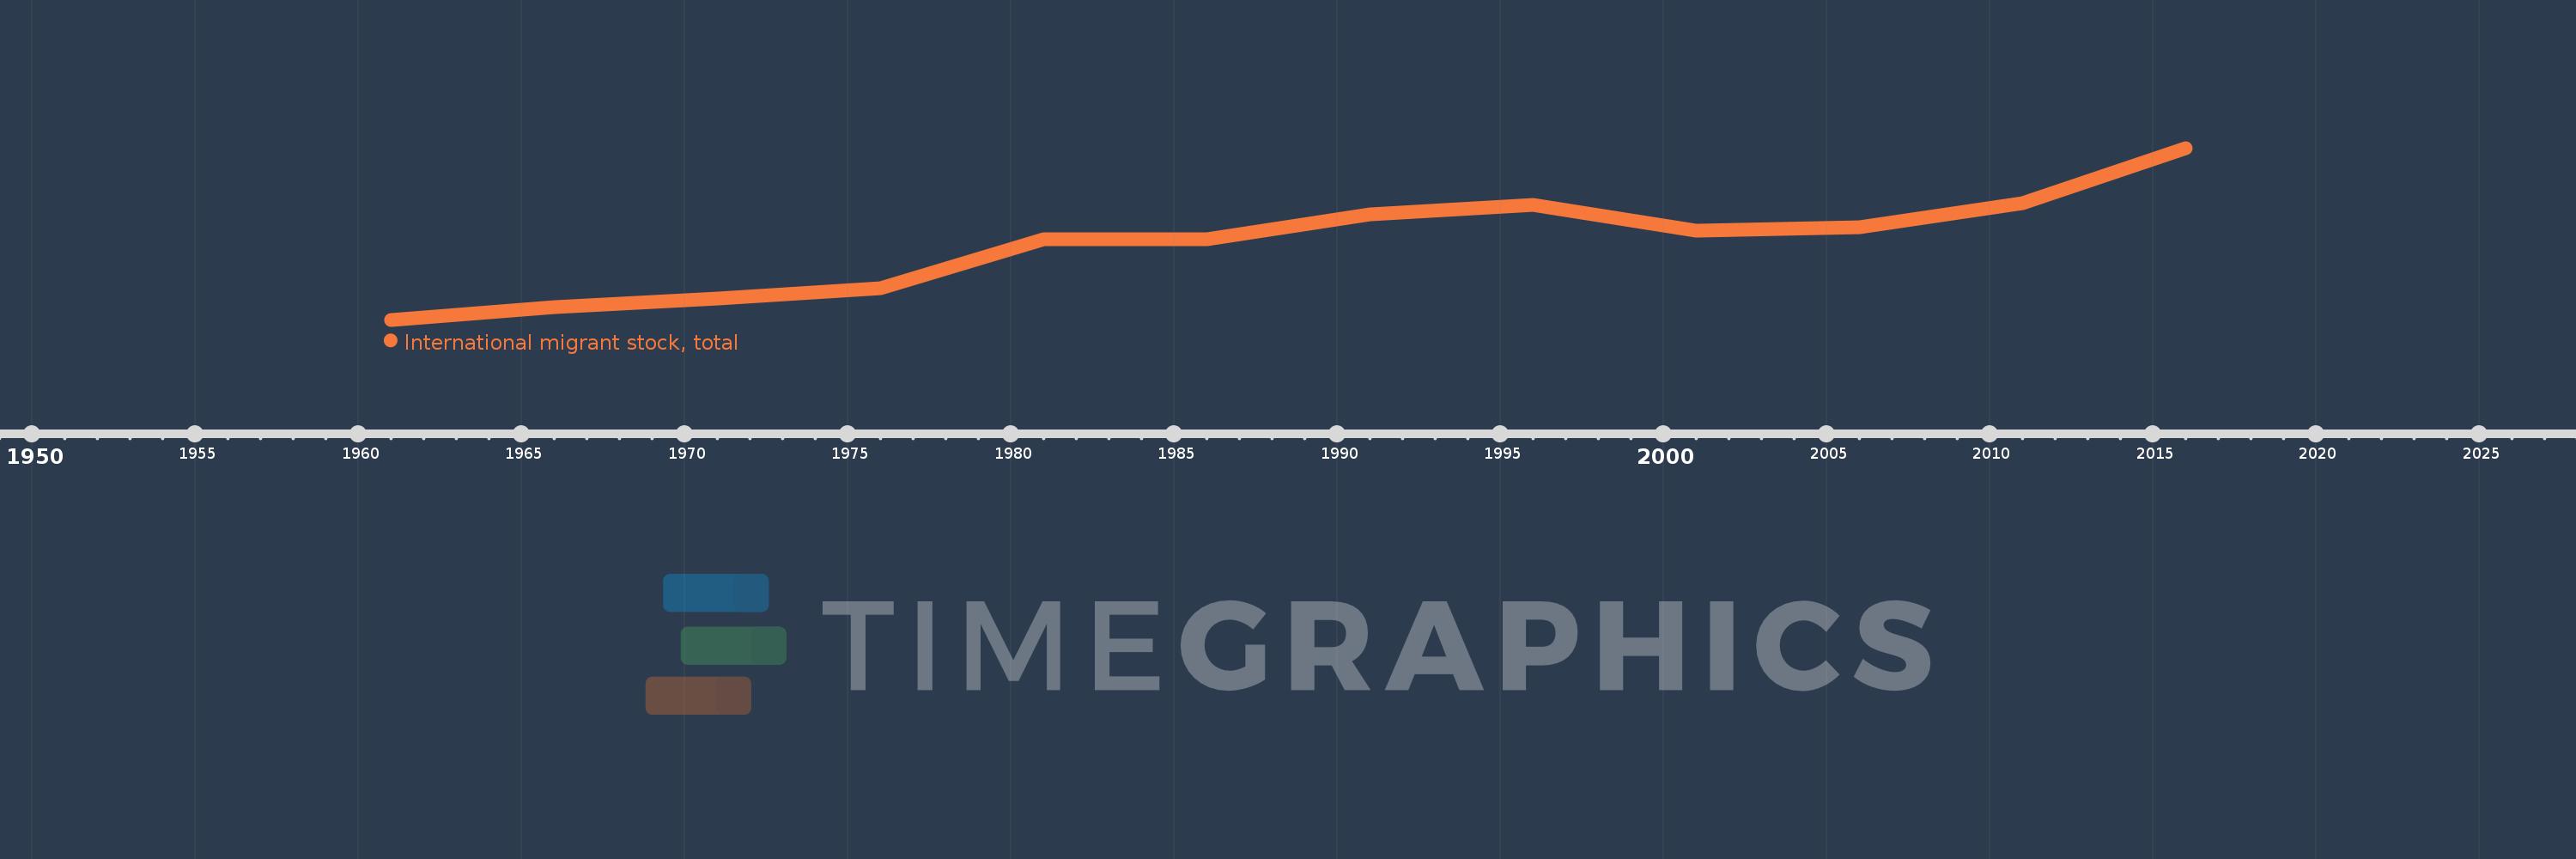
This timeline shows a graph from 1961 to 2016 of Sub-Saharan Africa (excluding high income). No data until 1960. Number of actual observations by date: 12.
Source name:
World Development Indicators
Source organization:
United Nations Population Division, Trends in Total Migrant Stock: 2012 Revision.
Categories, topics:
Financial Sector, Health
Last updated:
apr 23, 2017
Indicators value changes by year
Meaning:
12.682 mln
Minimum:
7.896 mln
jan 1, 1961
Maximum:
18.664 mln
jan 1, 2016
At the date of observation
Value
Absolute change
Change from the previous value
jan 1, 1961
7.896 mln
+7.896 mln
0.0%
jan 1, 1966
8.674 mln
+777.417K
9.85%
jan 1, 1971
9.244 mln
+570.46K
6.58%
jan 1, 1976
9.899 mln
+654.809K
7.08%
jan 1, 1981
12.916 mln
+3.017 mln
30.48%
jan 1, 1986
12.967 mln
+50.789K
0.39%
jan 1, 1991
14.492 mln
+1.525 mln
11.76%
jan 1, 1996
15.116 mln
+624.224K
4.31%
jan 1, 2001
13.463 mln
-1.653 mln
-10.93%
jan 1, 2006
13.671 mln
+208.358K
1.55%
jan 1, 2011
15.187 mln
+1.516 mln
11.09%
jan 1, 2016
18.664 mln
+3.477 mln
22.89%
Ranking of countries by current statistics by years