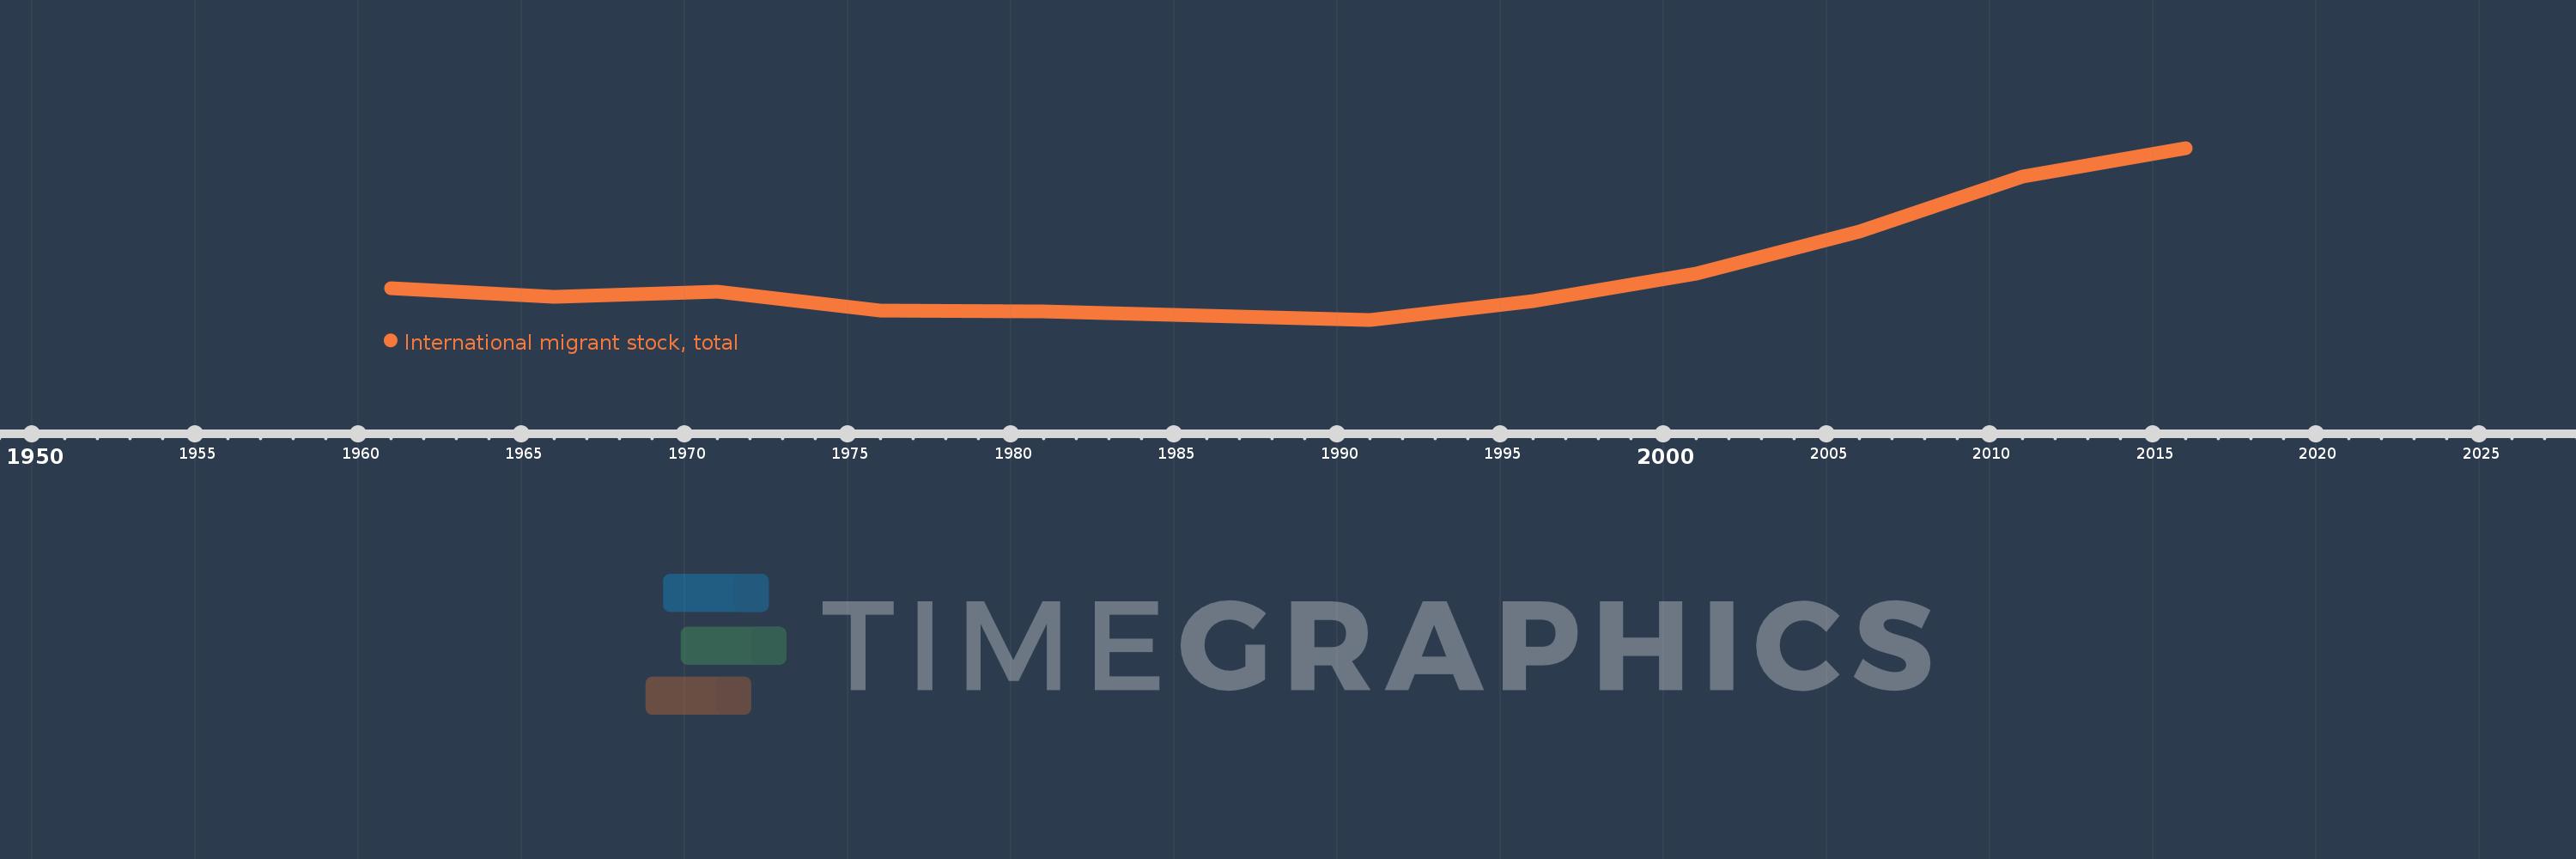
This timeline shows a graph from 1961 to 2016 of East Asia & Pacific (excluding high income). No data until 1960. Number of actual observations by date: 12.
Source name:
World Development Indicators
Source organization:
United Nations Population Division, Trends in Total Migrant Stock: 2012 Revision.
Categories, topics:
Financial Sector, Health
Last updated:
apr 23, 2017
Indicators value changes by year
Meaning:
4.185 mln
Minimum:
2.584 mln
jan 1, 1991
Maximum:
8.36 mln
jan 1, 2016
At the date of observation
Value
Absolute change
Change from the previous value
jan 1, 1961
3.655 mln
+3.655 mln
0.0%
jan 1, 1966
3.358 mln
-296.747K
-8.12%
jan 1, 1971
3.525 mln
+167.549K
4.99%
jan 1, 1976
2.892 mln
-633.546K
-17.97%
jan 1, 1981
2.858 mln
-34.084K
-1.18%
jan 1, 1986
2.714 mln
-143.699K
-5.03%
jan 1, 1991
2.584 mln
-130.618K
-4.81%
jan 1, 1996
3.205 mln
+621.323K
24.05%
jan 1, 2001
4.124 mln
+919.236K
28.68%
jan 1, 2006
5.541 mln
+1.417 mln
34.35%
jan 1, 2011
7.399 mln
+1.859 mln
33.55%
jan 1, 2016
8.36 mln
+960.322K
12.98%
Ranking of countries by current statistics by years