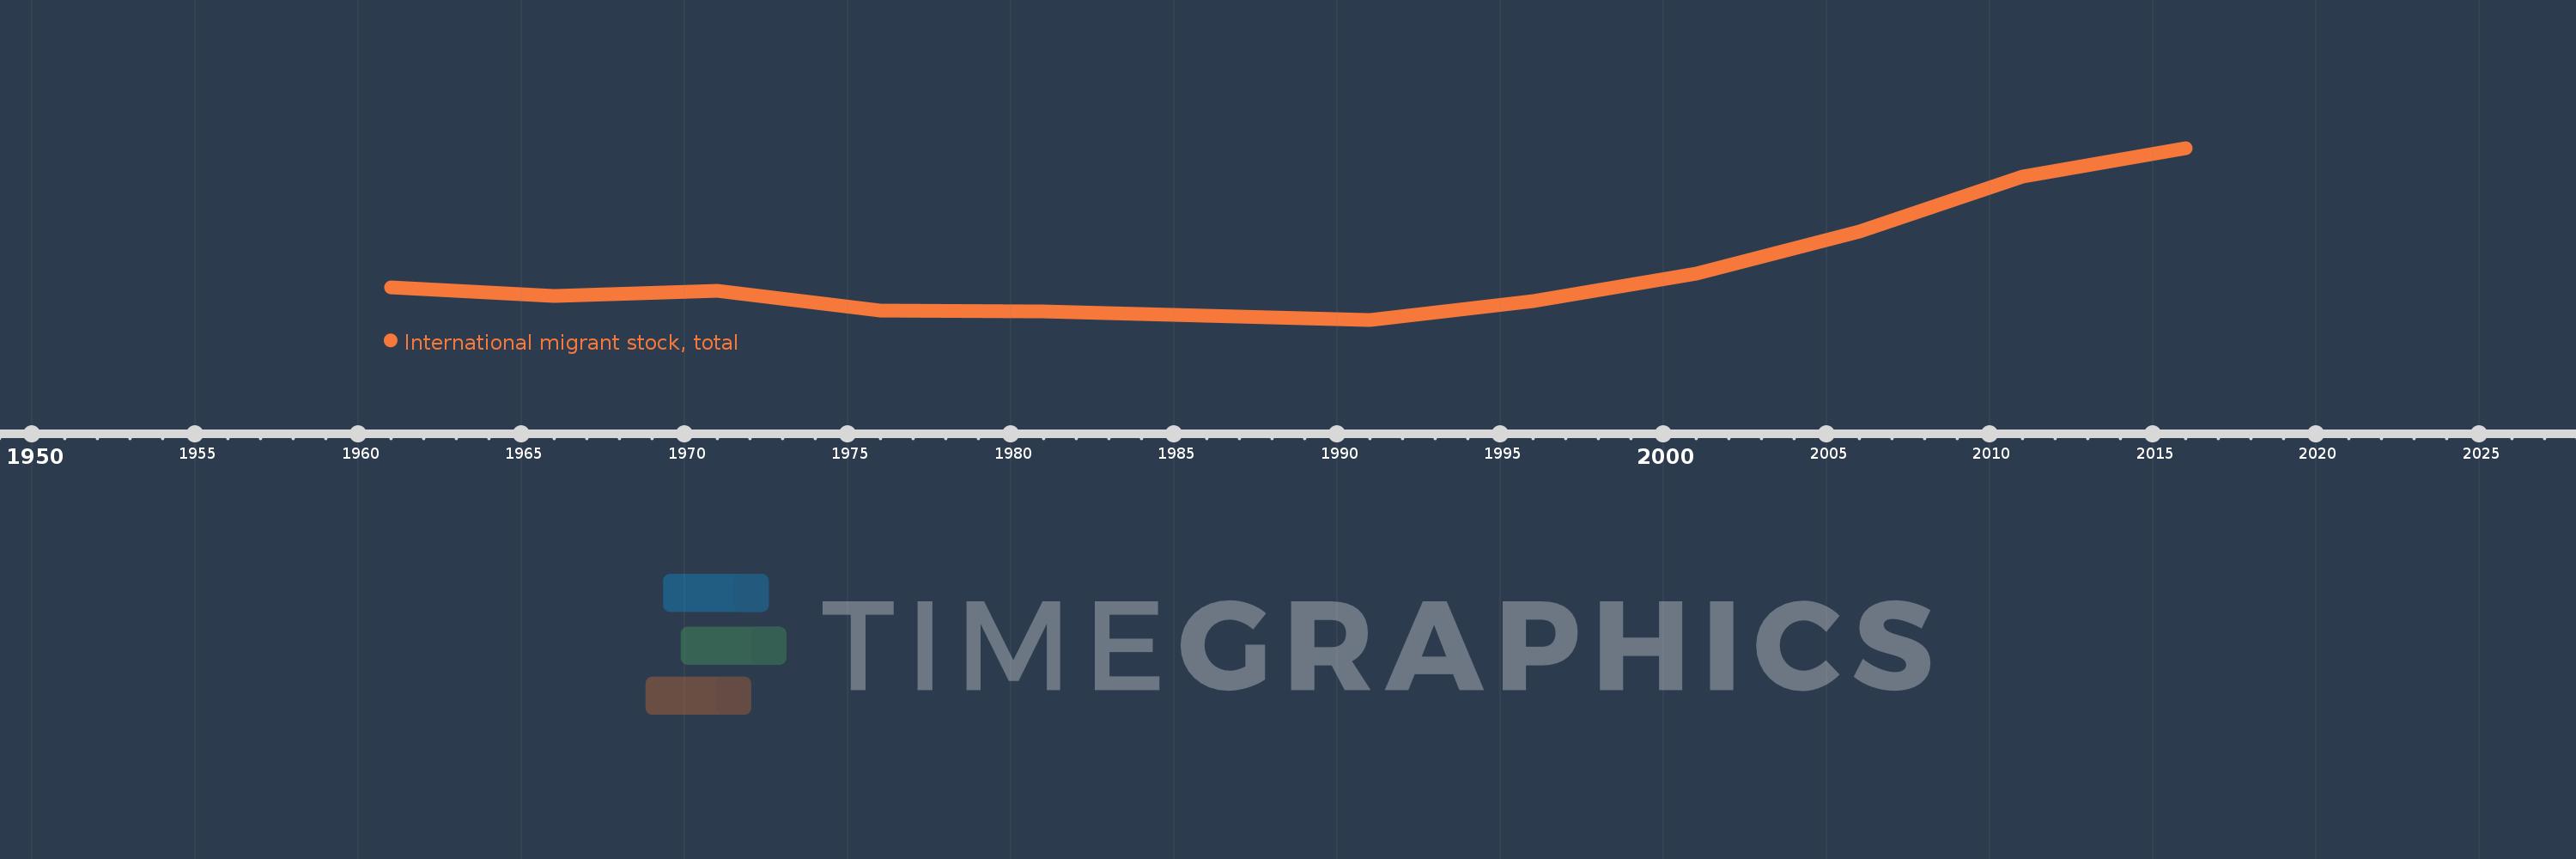
This timeline shows a graph from 1961 to 2016 of East Asia & Pacific (IDA & IBRD countries). No data until 1960. Number of actual observations by date: 12.
Source name:
World Development Indicators
Source organization:
United Nations Population Division, Trends in Total Migrant Stock: 2012 Revision.
Categories, topics:
Financial Sector, Health
Last updated:
apr 23, 2017
Indicators value changes by year
Meaning:
4.136 mln
Minimum:
2.531 mln
jan 1, 1991
Maximum:
8.291 mln
jan 1, 2016
At the date of observation
Value
Absolute change
Change from the previous value
jan 1, 1961
3.628 mln
+3.628 mln
0.0%
jan 1, 1966
3.328 mln
-299.516K
-8.26%
jan 1, 1971
3.491 mln
+163.144K
4.9%
jan 1, 1976
2.853 mln
-637.88K
-18.27%
jan 1, 1981
2.816 mln
-37.495K
-1.31%
jan 1, 1986
2.668 mln
-148.021K
-5.26%
jan 1, 1991
2.531 mln
-136.902K
-5.13%
jan 1, 1996
3.149 mln
+618.258K
24.43%
jan 1, 2001
4.065 mln
+916.171K
29.09%
jan 1, 2006
5.479 mln
+1.413 mln
34.76%
jan 1, 2011
7.334 mln
+1.855 mln
33.87%
jan 1, 2016
8.291 mln
+957.279K
13.05%
Ranking of countries by current statistics by years