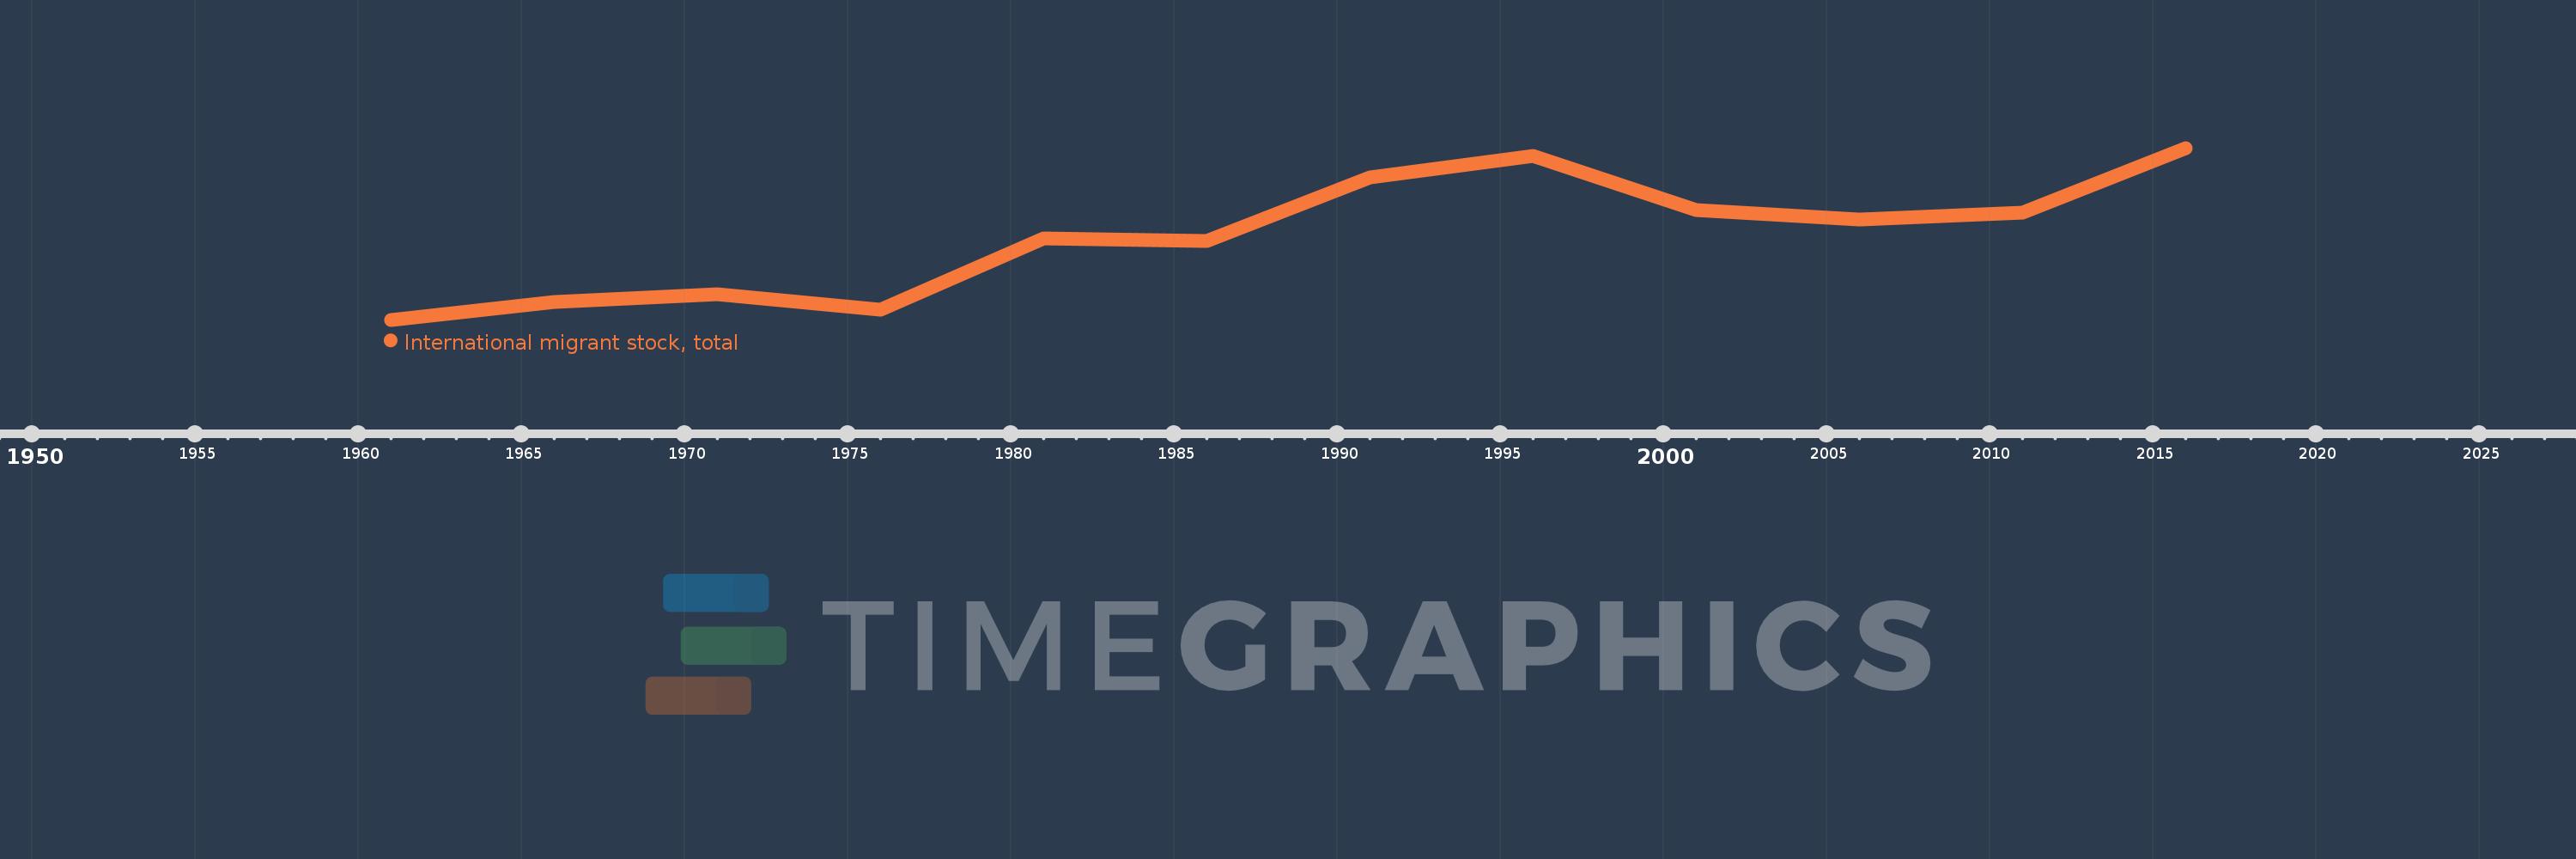
This timeline shows a graph from 1961 to 2016 of Least developed countries: UN classification. No data until 1960. Number of actual observations by date: 12.
Source name:
World Development Indicators
Source organization:
United Nations Population Division, Trends in Total Migrant Stock: 2012 Revision.
Categories, topics:
Financial Sector, Health
Last updated:
apr 23, 2017
Indicators value changes by year
Meaning:
9.312 mln
Minimum:
6.783 mln
jan 1, 1961
Maximum:
11.951 mln
jan 1, 2016
At the date of observation
Value
Absolute change
Change from the previous value
jan 1, 1961
6.783 mln
+6.783 mln
0.0%
jan 1, 1966
7.311 mln
+527.949K
7.78%
jan 1, 1971
7.551 mln
+240.01K
3.28%
jan 1, 1976
7.082 mln
-469.707K
-6.22%
jan 1, 1981
9.23 mln
+2.149 mln
30.34%
jan 1, 1986
9.143 mln
-86.861K
-0.94%
jan 1, 1991
11.076 mln
+1.933 mln
21.14%
jan 1, 1996
11.712 mln
+635.737K
5.74%
jan 1, 2001
10.078 mln
-1.634 mln
-13.95%
jan 1, 2006
9.81 mln
-268.19K
-2.66%
jan 1, 2011
10.018 mln
+208.494K
2.13%
jan 1, 2016
11.951 mln
+1.933 mln
19.3%
Ranking of countries by current statistics by years