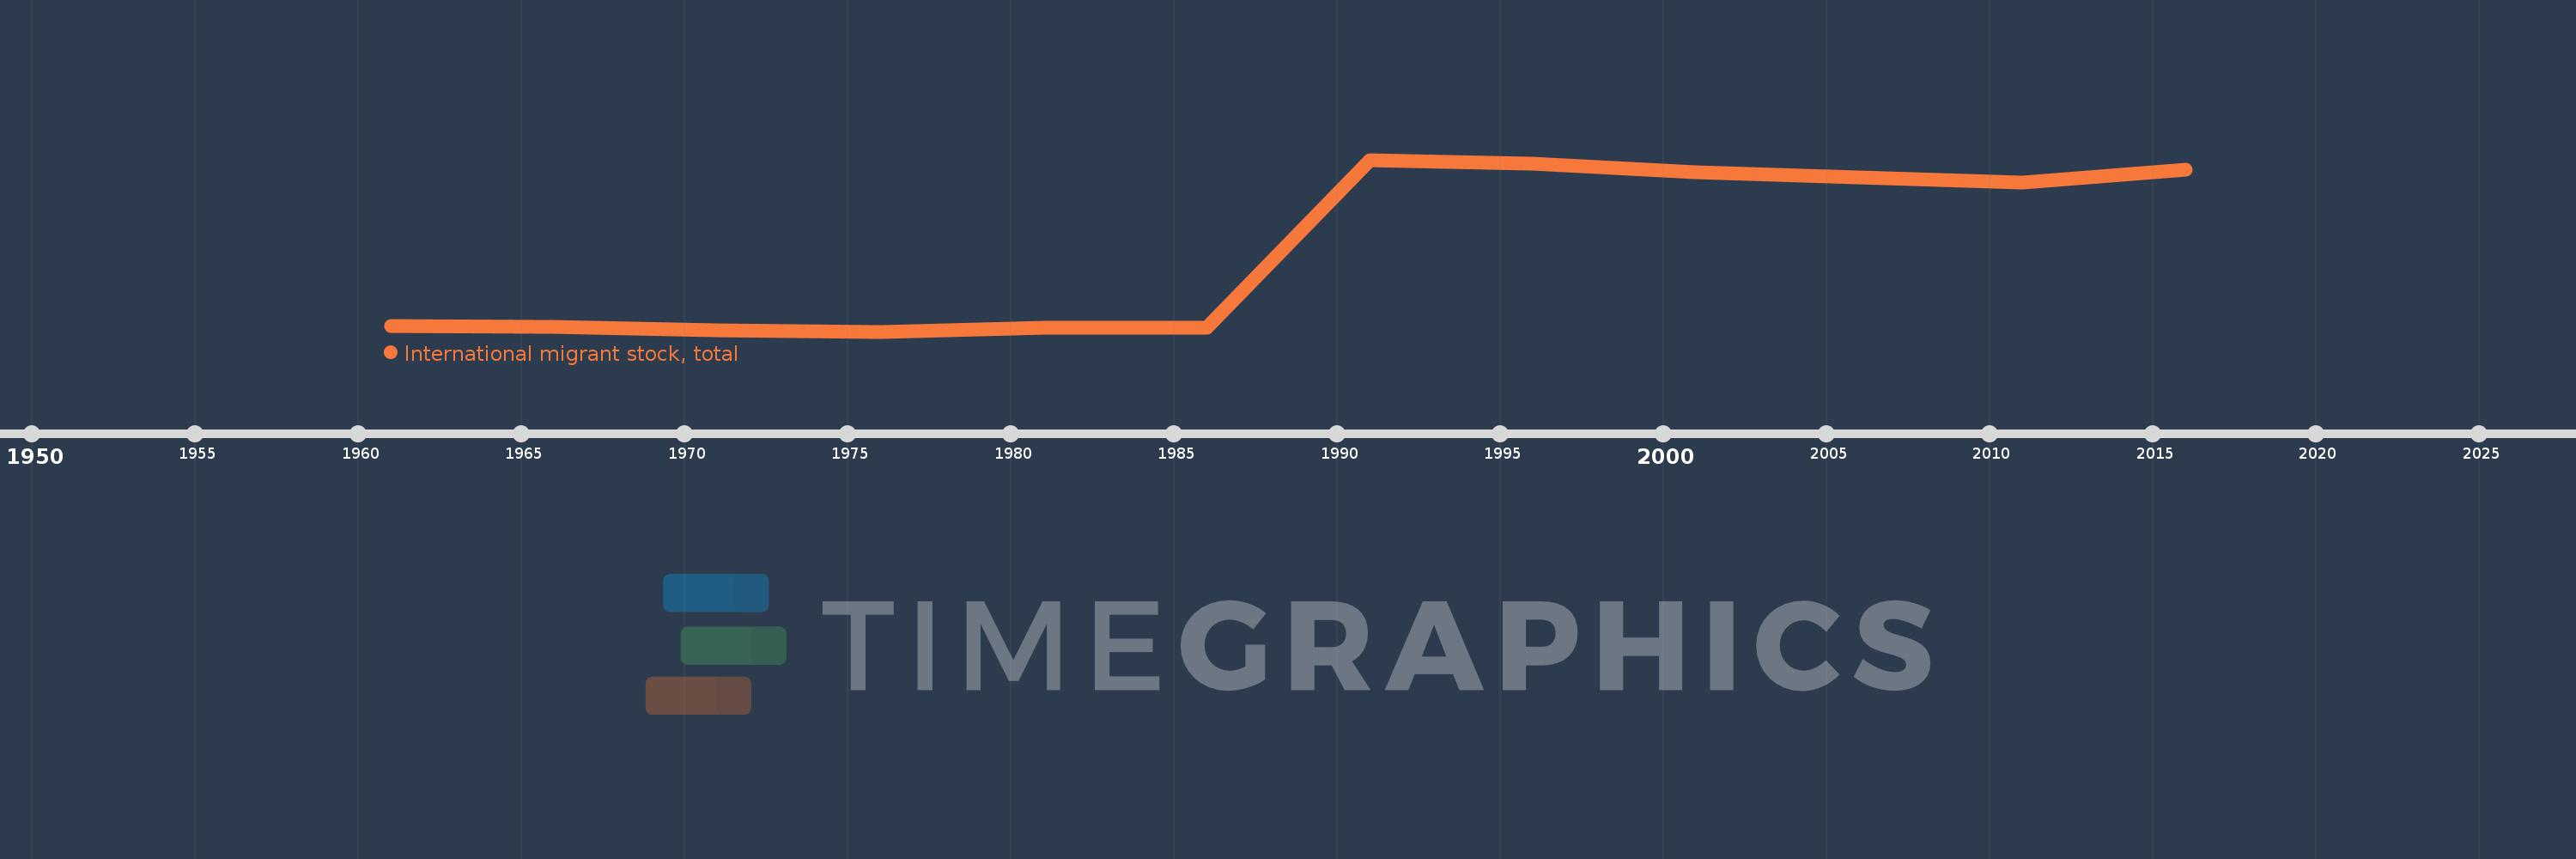
This timeline shows a graph from 1961 to 2016 of Europe & Central Asia (excluding high income). No data until 1960. Number of actual observations by date: 12.
Source name:
World Development Indicators
Source organization:
United Nations Population Division, Trends in Total Migrant Stock: 2012 Revision.
Categories, topics:
Financial Sector, Health
Last updated:
apr 23, 2017
Indicators value changes by year
Meaning:
14.479 mln
Minimum:
461.893K
jan 1, 1976
Maximum:
29.837 mln
jan 1, 1991
At the date of observation
Value
Absolute change
Change from the previous value
jan 1, 1961
1.348 mln
+1.348 mln
0.0%
jan 1, 1966
1.328 mln
-19.424K
-1.44%
jan 1, 1971
735.465K
-592.82K
-44.63%
jan 1, 1976
461.893K
-273.572K
-37.2%
jan 1, 1981
1.067 mln
+605.044K
130.99%
jan 1, 1986
1.187 mln
+120.246K
11.27%
jan 1, 1991
29.837 mln
+28.65 mln
2.41K%
jan 1, 1996
29.125 mln
-711.453K
-2.38%
jan 1, 2001
27.78 mln
-1.345 mln
-4.62%
jan 1, 2006
26.819 mln
-961.115K
-3.46%
jan 1, 2011
25.93 mln
-889.189K
-3.32%
jan 1, 2016
28.129 mln
+2.199 mln
8.48%
Ranking of countries by current statistics by years