33
/
AIzaSyB4mHJ5NPEv-XzF7P6NDYXjlkCWaeKw5bc
November 30, 2025
51965
North America
NAC
false
2
1
International migrant stock, total
2016,2011,2006,2001,1996,1991,1986,1981,1976,1971,1966,1961
Create a timeline
Public Timelines
For education
For educational institutions
For teachers
For students
Cabinet
For educational institutions
For teachers
For students
Open cabinet
FAQ
Close
Create a timeline
Public timelines
FAQ
About & Feedback
Terms
Privacy
FAQ
Support 24/7
Cabinet
Get premium
Donate
Download
Global statistics library
→
North America
→
International migrant stock, total
This statistics in other country:
Afghanistan
Albania
Algeria
American Samoa
Andorra
Angola
Antigua and Barbuda
Arab World
Argentina
Armenia
Aruba
Australia
Austria
Azerbaijan
Bahamas, The
Bahrain
Bangladesh
Barbados
Belarus
Belgium
Belize
Benin
Bermuda
Bhutan
Bolivia
Bosnia and Herzegovina
Botswana
Brazil
British Virgin Islands
Brunei Darussalam
Bulgaria
Burkina Faso
Burundi
Cabo Verde
Cambodia
Cameroon
Canada
Caribbean small states
Cayman Islands
Central African Republic
Central Europe and the Baltics
Chad
Channel Islands
Chile
China
Colombia
Comoros
Congo, Dem. Rep.
Congo, Rep.
Costa Rica
Cote d'Ivoire
Croatia
Cuba
Curacao
Cyprus
Czech Republic
Denmark
Djibouti
Dominica
Dominican Republic
Early-demographic dividend
East Asia & Pacific
East Asia & Pacific (excluding high income)
East Asia & Pacific (IDA & IBRD countries)
Ecuador
Egypt, Arab Rep.
El Salvador
Equatorial Guinea
Eritrea
Estonia
Ethiopia
Euro area
Europe & Central Asia
Europe & Central Asia (excluding high income)
Europe & Central Asia (IDA & IBRD countries)
European Union
Faroe Islands
Fiji
Finland
Fragile and conflict affected situations
France
French Polynesia
Gabon
Gambia, The
Georgia
Germany
Ghana
Gibraltar
Greece
Greenland
Grenada
Guam
Guatemala
Guinea
Guinea-Bissau
Guyana
Haiti
Heavily indebted poor countries (HIPC)
High income
Honduras
Hong Kong SAR, China
Hungary
IBRD only
Iceland
IDA & IBRD total
IDA blend
IDA only
IDA total
India
Indonesia
Iran, Islamic Rep.
Iraq
Ireland
Isle of Man
Israel
Italy
Jamaica
Japan
Jordan
Kazakhstan
Kenya
Kiribati
Korea, Dem. People’s Rep.
Korea, Rep.
Kuwait
Kyrgyz Republic
Lao PDR
Late-demographic dividend
Latin America & Caribbean
Latin America & Caribbean (excluding high income)
Latin America & the Caribbean (IDA & IBRD countries)
Latvia
Least developed countries: UN classification
Lebanon
Lesotho
Liberia
Libya
Liechtenstein
Lithuania
Low & middle income
Low income
Lower middle income
Luxembourg
Macao SAR, China
Macedonia, FYR
Madagascar
Malawi
Malaysia
Maldives
Mali
Malta
Marshall Islands
Mauritania
Mauritius
Mexico
Micronesia, Fed. Sts.
Middle East & North Africa
Middle East & North Africa (excluding high income)
Middle East & North Africa (IDA & IBRD countries)
Middle income
Moldova
Monaco
Mongolia
Montenegro
Morocco
Mozambique
Myanmar
Namibia
Nauru
Nepal
Netherlands
New Caledonia
New Zealand
Nicaragua
Niger
Nigeria
North America
Northern Mariana Islands
Norway
OECD members
Oman
Other small states
Pacific island small states
Pakistan
Palau
Panama
Papua New Guinea
Paraguay
Peru
Philippines
Poland
Portugal
Post-demographic dividend
Pre-demographic dividend
Puerto Rico
Qatar
Romania
Russian Federation
Rwanda
Samoa
San Marino
Sao Tome and Principe
Saudi Arabia
Senegal
Serbia
Seychelles
Sierra Leone
Singapore
Sint Maarten (Dutch part)
Slovak Republic
Slovenia
Small states
Solomon Islands
Somalia
South Africa
South Asia
South Asia (IDA & IBRD)
South Sudan
Spain
Sri Lanka
St. Kitts and Nevis
St. Lucia
St. Vincent and the Grenadines
Sub-Saharan Africa
Sub-Saharan Africa (excluding high income)
Sub-Saharan Africa (IDA & IBRD countries)
Sudan
Suriname
Swaziland
Sweden
Switzerland
Syrian Arab Republic
Tajikistan
Tanzania
Thailand
Timor-Leste
Togo
Tonga
Trinidad and Tobago
Tunisia
Turkey
Turkmenistan
Turks and Caicos Islands
Tuvalu
Uganda
Ukraine
United Arab Emirates
United Kingdom
United States
Upper middle income
Uruguay
Uzbekistan
Vanuatu
Venezuela, RB
Vietnam
Virgin Islands (U.S.)
West Bank and Gaza
World
Yemen, Rep.
Zambia
Zimbabwe
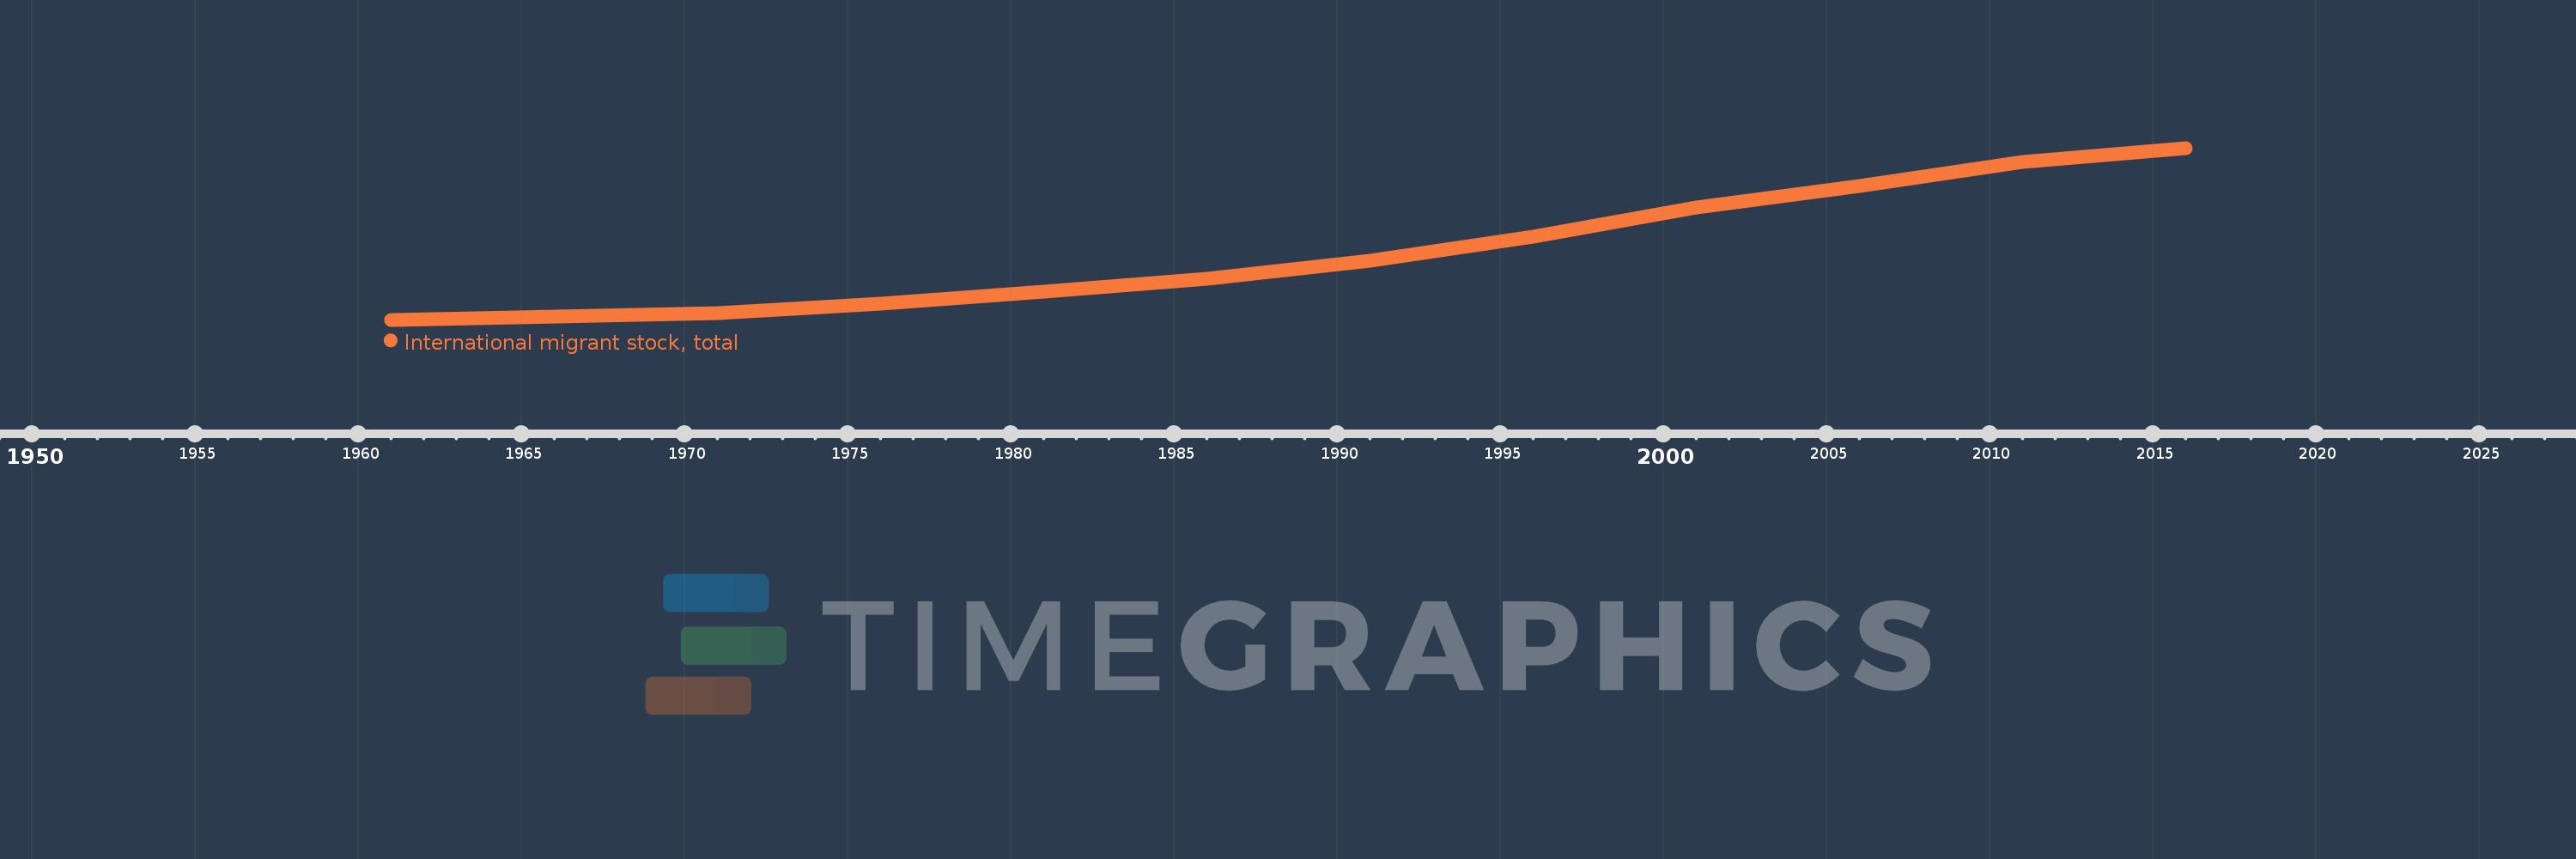
Timeline:
This timeline shows a graph from
1961
to
2016
of North America. No data until
1960
. Number of actual observations by date:
12
.
Source name:
World Development Indicators
Source organization:
United Nations Population Division, Trends in Total Migrant Stock: 2012 Revision.
Categories, topics:
Financial Sector, Health
Last updated:
apr 23, 2017
Indicators value changes by year
Meaning:
29.723 mln
Minimum:
13.601 mln
jan 1, 1961
Maximum:
54.482 mln
jan 1, 2016
At the date of observation
Value
Absolute change
Change from the previous value
jan 1, 1961
13.601 mln
+13.601 mln
0.0%
jan 1, 1966
14.386 mln
+785.422K
5.77%
jan 1, 1971
15.239 mln
+853.324K
5.93%
jan 1, 1976
17.524 mln
+2.284 mln
14.99%
jan 1, 1981
20.189 mln
+2.666 mln
15.21%
jan 1, 1986
23.407 mln
+3.218 mln
15.94%
jan 1, 1991
27.6 mln
+4.193 mln
17.91%
jan 1, 1996
33.333 mln
+5.732 mln
20.77%
jan 1, 2001
40.344 mln
+7.011 mln
21.03%
jan 1, 2006
45.356 mln
+5.012 mln
12.42%
jan 1, 2011
51.214 mln
+5.858 mln
12.92%
jan 1, 2016
54.482 mln
+3.268 mln
6.38%
Ranking of countries by current statistics by years
About & Feedback
Terms
Privacy
FAQ
Support 24/7
Cabinet
Get premium
Donate
The service accepts bank transfer (ACH, Wire) or cards (Visa, MasterCard, etc). Processed by Stripe.
Secured with SSL