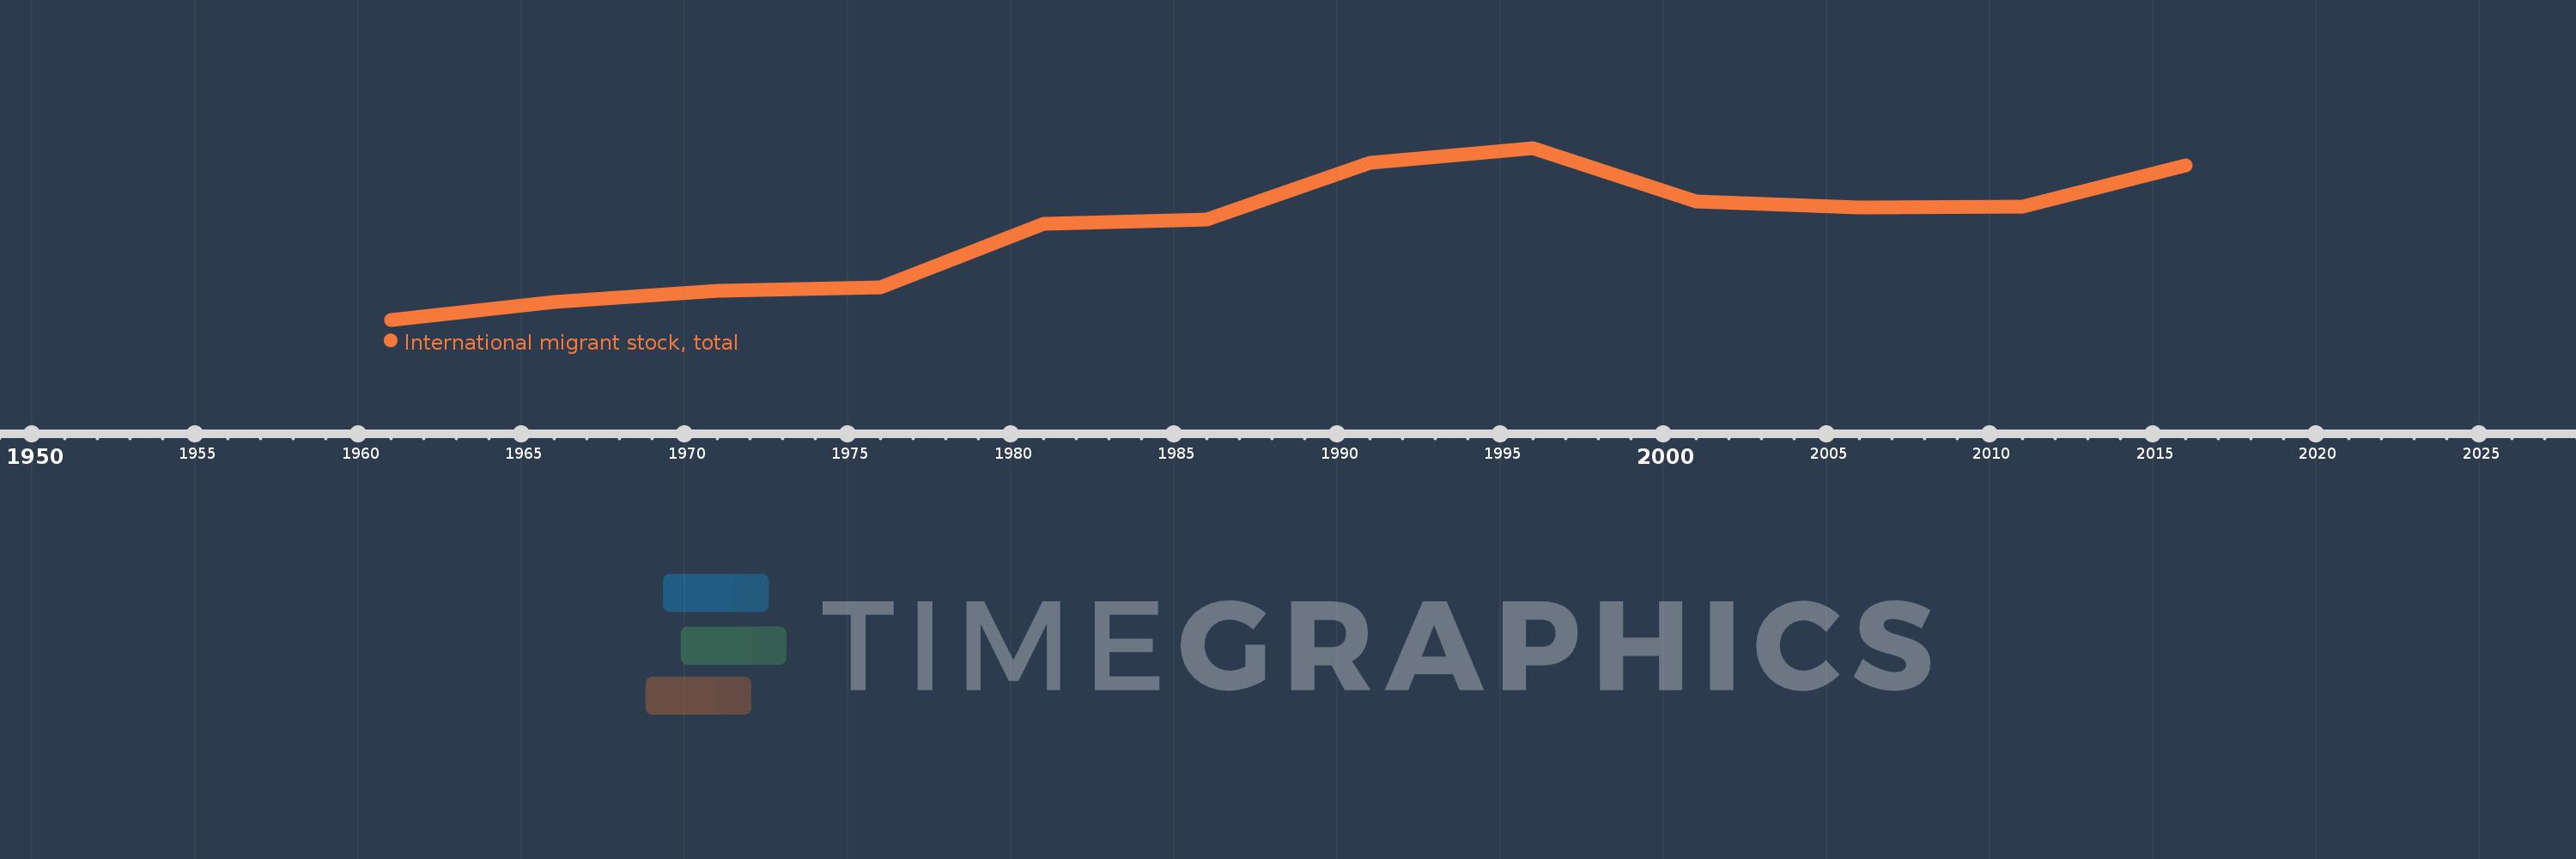
This timeline shows a graph from 1961 to 2016 of Heavily indebted poor countries (HIPC). No data until 1960. Number of actual observations by date: 12.
Source name:
World Development Indicators
Source organization:
United Nations Population Division, Trends in Total Migrant Stock: 2012 Revision.
Categories, topics:
Financial Sector, Health
Last updated:
apr 23, 2017
Indicators value changes by year
Meaning:
9.685 mln
Minimum:
6.385 mln
jan 1, 1961
Maximum:
12.557 mln
jan 1, 1996
At the date of observation
Value
Absolute change
Change from the previous value
jan 1, 1961
6.385 mln
+6.385 mln
0.0%
jan 1, 1966
7.013 mln
+628.291K
9.84%
jan 1, 1971
7.428 mln
+415.015K
5.92%
jan 1, 1976
7.541 mln
+113.002K
1.52%
jan 1, 1981
9.847 mln
+2.306 mln
30.58%
jan 1, 1986
10.0 mln
+153.152K
1.56%
jan 1, 1991
12.008 mln
+2.008 mln
20.09%
jan 1, 1996
12.557 mln
+549.184K
4.57%
jan 1, 2001
10.633 mln
-1.925 mln
-15.33%
jan 1, 2006
10.419 mln
-213.612K
-2.01%
jan 1, 2011
10.451 mln
+31.756K
0.3%
jan 1, 2016
11.941 mln
+1.491 mln
14.26%
Ranking of countries by current statistics by years