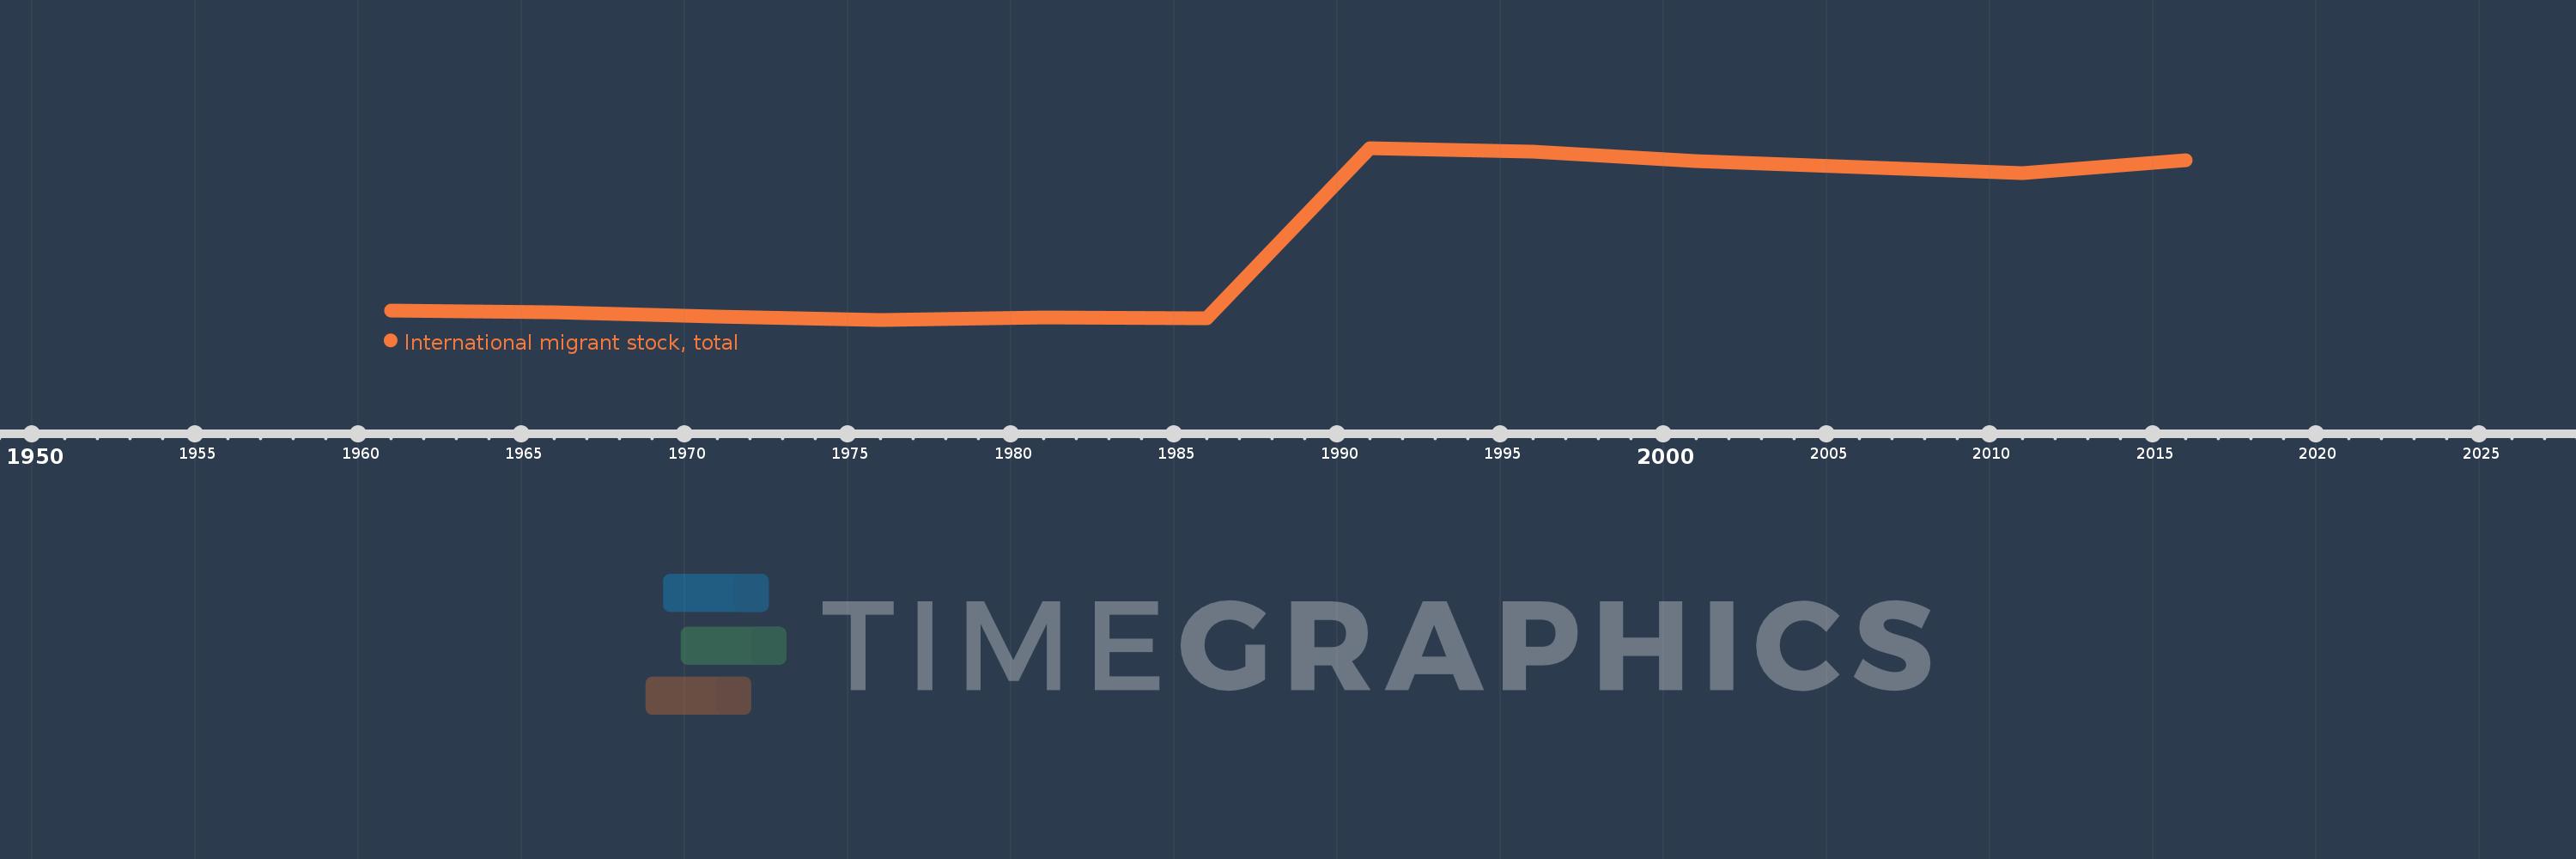
This timeline shows a graph from 1961 to 2016 of Europe & Central Asia (IDA & IBRD countries). No data until 1960. Number of actual observations by date: 12.
Source name:
World Development Indicators
Source organization:
United Nations Population Division, Trends in Total Migrant Stock: 2012 Revision.
Categories, topics:
Financial Sector, Health
Last updated:
apr 23, 2017
Indicators value changes by year
Meaning:
16.129 mln
Minimum:
2.27 mln
jan 1, 1976
Maximum:
31.44 mln
jan 1, 1991
At the date of observation
Value
Absolute change
Change from the previous value
jan 1, 1961
3.773 mln
+3.773 mln
0.0%
jan 1, 1966
3.578 mln
-194.637K
-5.16%
jan 1, 1971
2.823 mln
-754.461K
-21.09%
jan 1, 1976
2.27 mln
-553.62K
-19.61%
jan 1, 1981
2.612 mln
+341.854K
15.06%
jan 1, 1986
2.507 mln
-104.631K
-4.01%
jan 1, 1991
31.44 mln
+28.933 mln
1.15K%
jan 1, 1996
30.764 mln
-675.852K
-2.15%
jan 1, 2001
29.191 mln
-1.574 mln
-5.11%
jan 1, 2006
28.121 mln
-1.07 mln
-3.67%
jan 1, 2011
27.145 mln
-975.306K
-3.47%
jan 1, 2016
29.325 mln
+2.18 mln
8.03%
Ranking of countries by current statistics by years