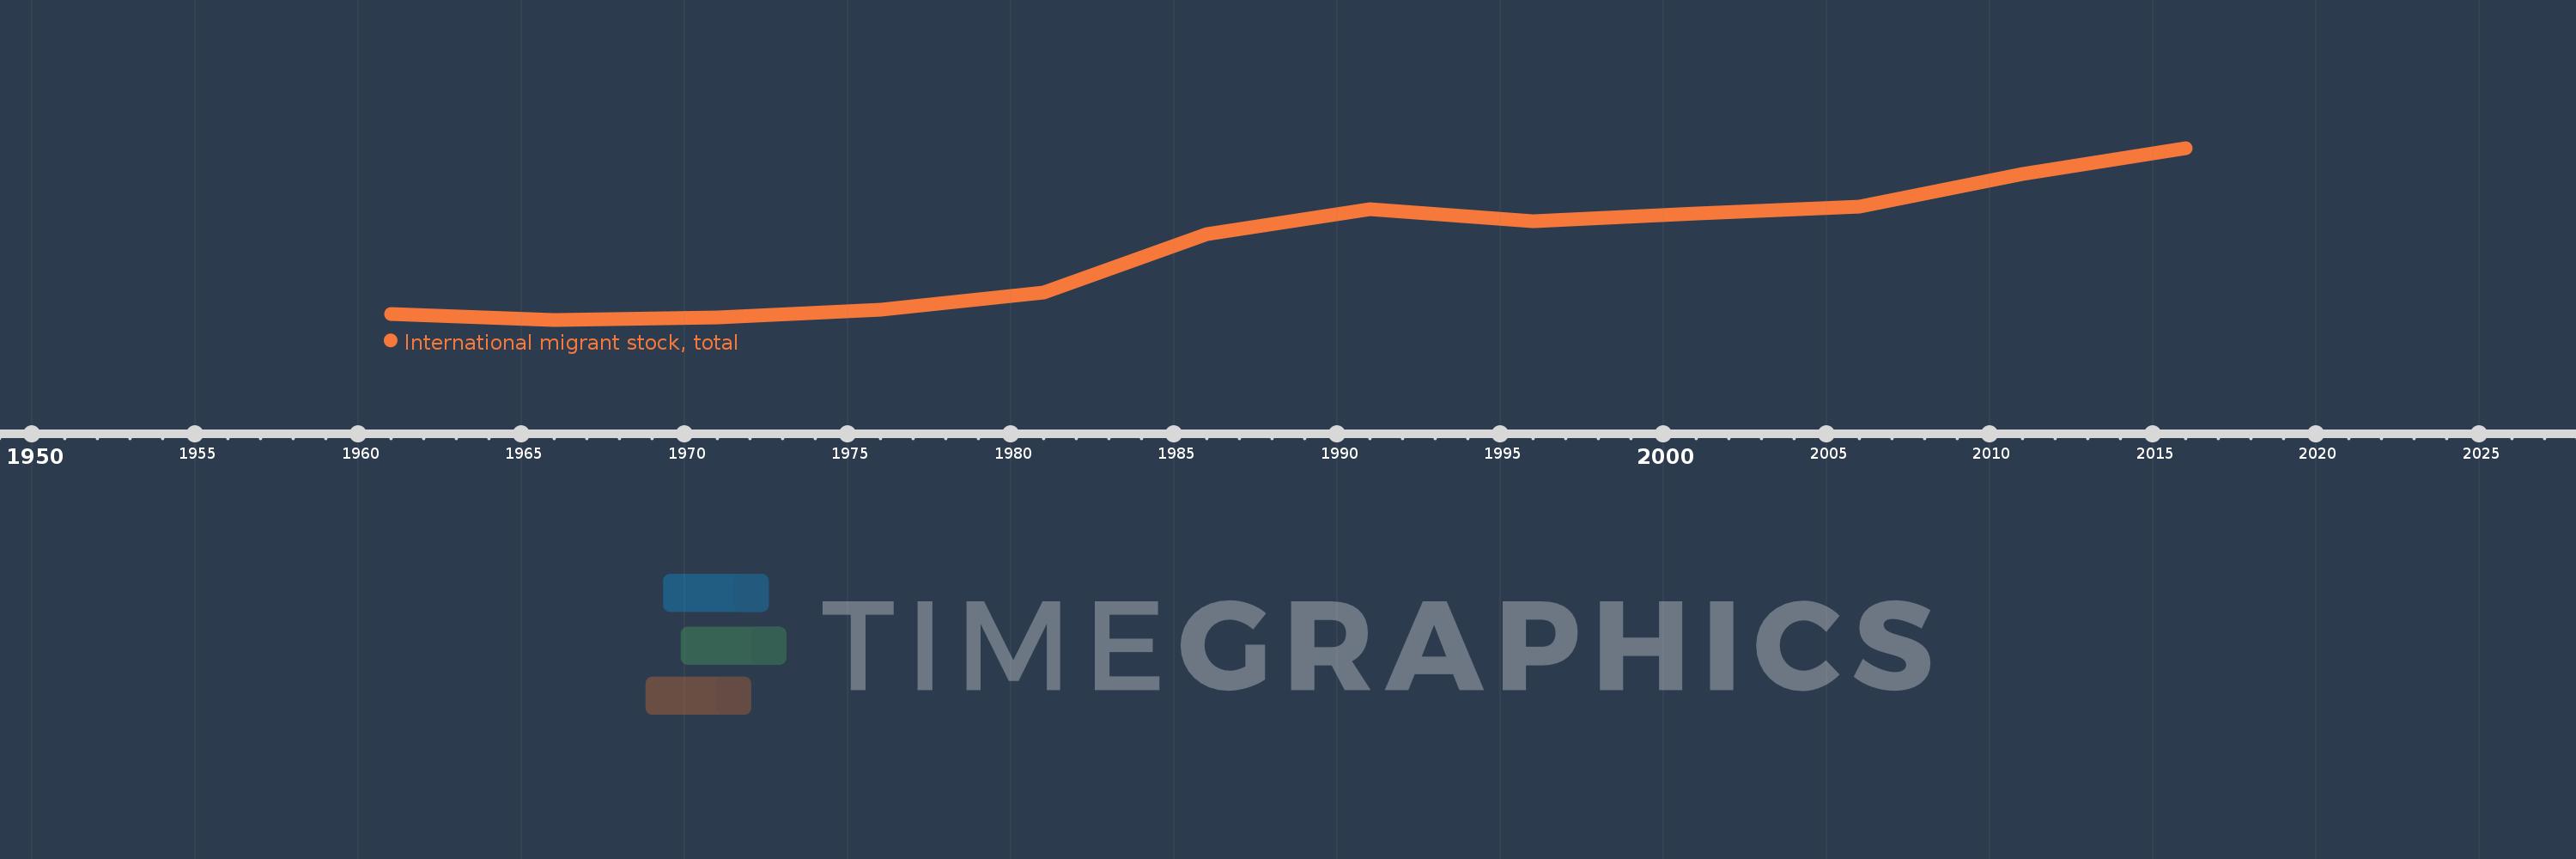
This timeline shows a graph from 1961 to 2016 of Middle East & North Africa (excluding high income). No data until 1960. Number of actual observations by date: 12.
Source name:
World Development Indicators
Source organization:
United Nations Population Division, Trends in Total Migrant Stock: 2012 Revision.
Categories, topics:
Financial Sector, Health
Last updated:
apr 23, 2017
Indicators value changes by year
Meaning:
6.353 mln
Minimum:
2.59 mln
jan 1, 1966
Maximum:
11.428 mln
jan 1, 2016
At the date of observation
Value
Absolute change
Change from the previous value
jan 1, 1961
2.865 mln
+2.865 mln
0.0%
jan 1, 1966
2.59 mln
-275.607K
-9.62%
jan 1, 1971
2.726 mln
+136.899K
5.29%
jan 1, 1976
3.124 mln
+397.706K
14.59%
jan 1, 1981
3.997 mln
+872.786K
27.94%
jan 1, 1986
6.998 mln
+3.001 mln
75.07%
jan 1, 1991
8.286 mln
+1.289 mln
18.42%
jan 1, 1996
7.656 mln
-630.004K
-7.6%
jan 1, 2001
8.067 mln
+410.594K
5.36%
jan 1, 2006
8.426 mln
+359.36K
4.45%
jan 1, 2011
10.069 mln
+1.642 mln
19.49%
jan 1, 2016
11.428 mln
+1.359 mln
13.5%
Ranking of countries by current statistics by years