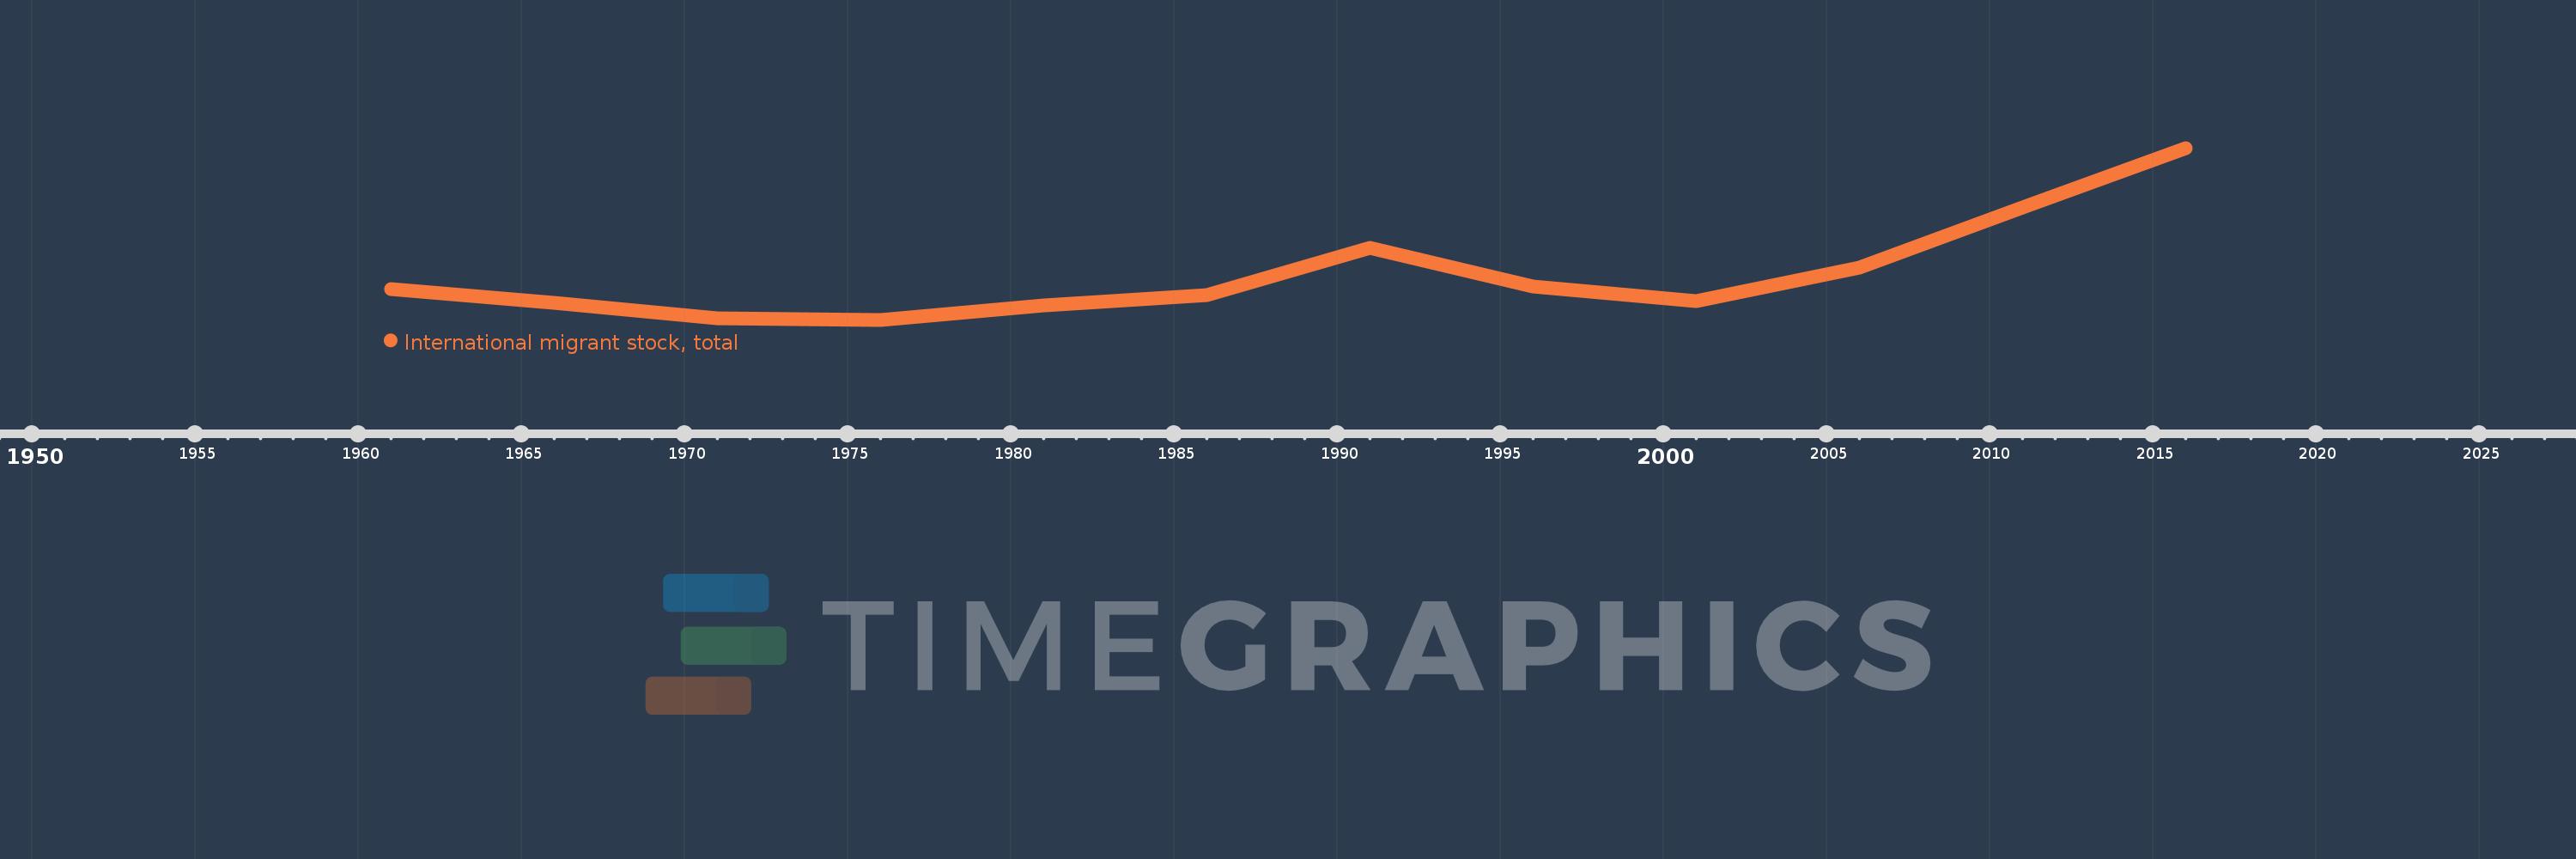
This timeline shows a graph from 1961 to 2016 of Latin America & Caribbean (excluding high income). No data until 1960. Number of actual observations by date: 12.
Source name:
World Development Indicators
Source organization:
United Nations Population Division, Trends in Total Migrant Stock: 2012 Revision.
Categories, topics:
Financial Sector, Health
Last updated:
apr 23, 2017
Indicators value changes by year
Meaning:
5.834 mln
Minimum:
5.143 mln
jan 1, 1976
Maximum:
7.74 mln
jan 1, 2016
At the date of observation
Value
Absolute change
Change from the previous value
jan 1, 1961
5.604 mln
+5.604 mln
0.0%
jan 1, 1966
5.395 mln
-209.364K
-3.74%
jan 1, 1971
5.163 mln
-232.103K
-4.3%
jan 1, 1976
5.143 mln
-19.615K
-0.38%
jan 1, 1981
5.358 mln
+214.603K
4.17%
jan 1, 1986
5.52 mln
+162.229K
3.03%
jan 1, 1991
6.224 mln
+704.352K
12.76%
jan 1, 1996
5.648 mln
-576.624K
-9.26%
jan 1, 2001
5.428 mln
-219.989K
-3.9%
jan 1, 2006
5.936 mln
+508.539K
9.37%
jan 1, 2011
6.846 mln
+909.952K
15.33%
jan 1, 2016
7.74 mln
+894.1K
13.06%
Ranking of countries by current statistics by years