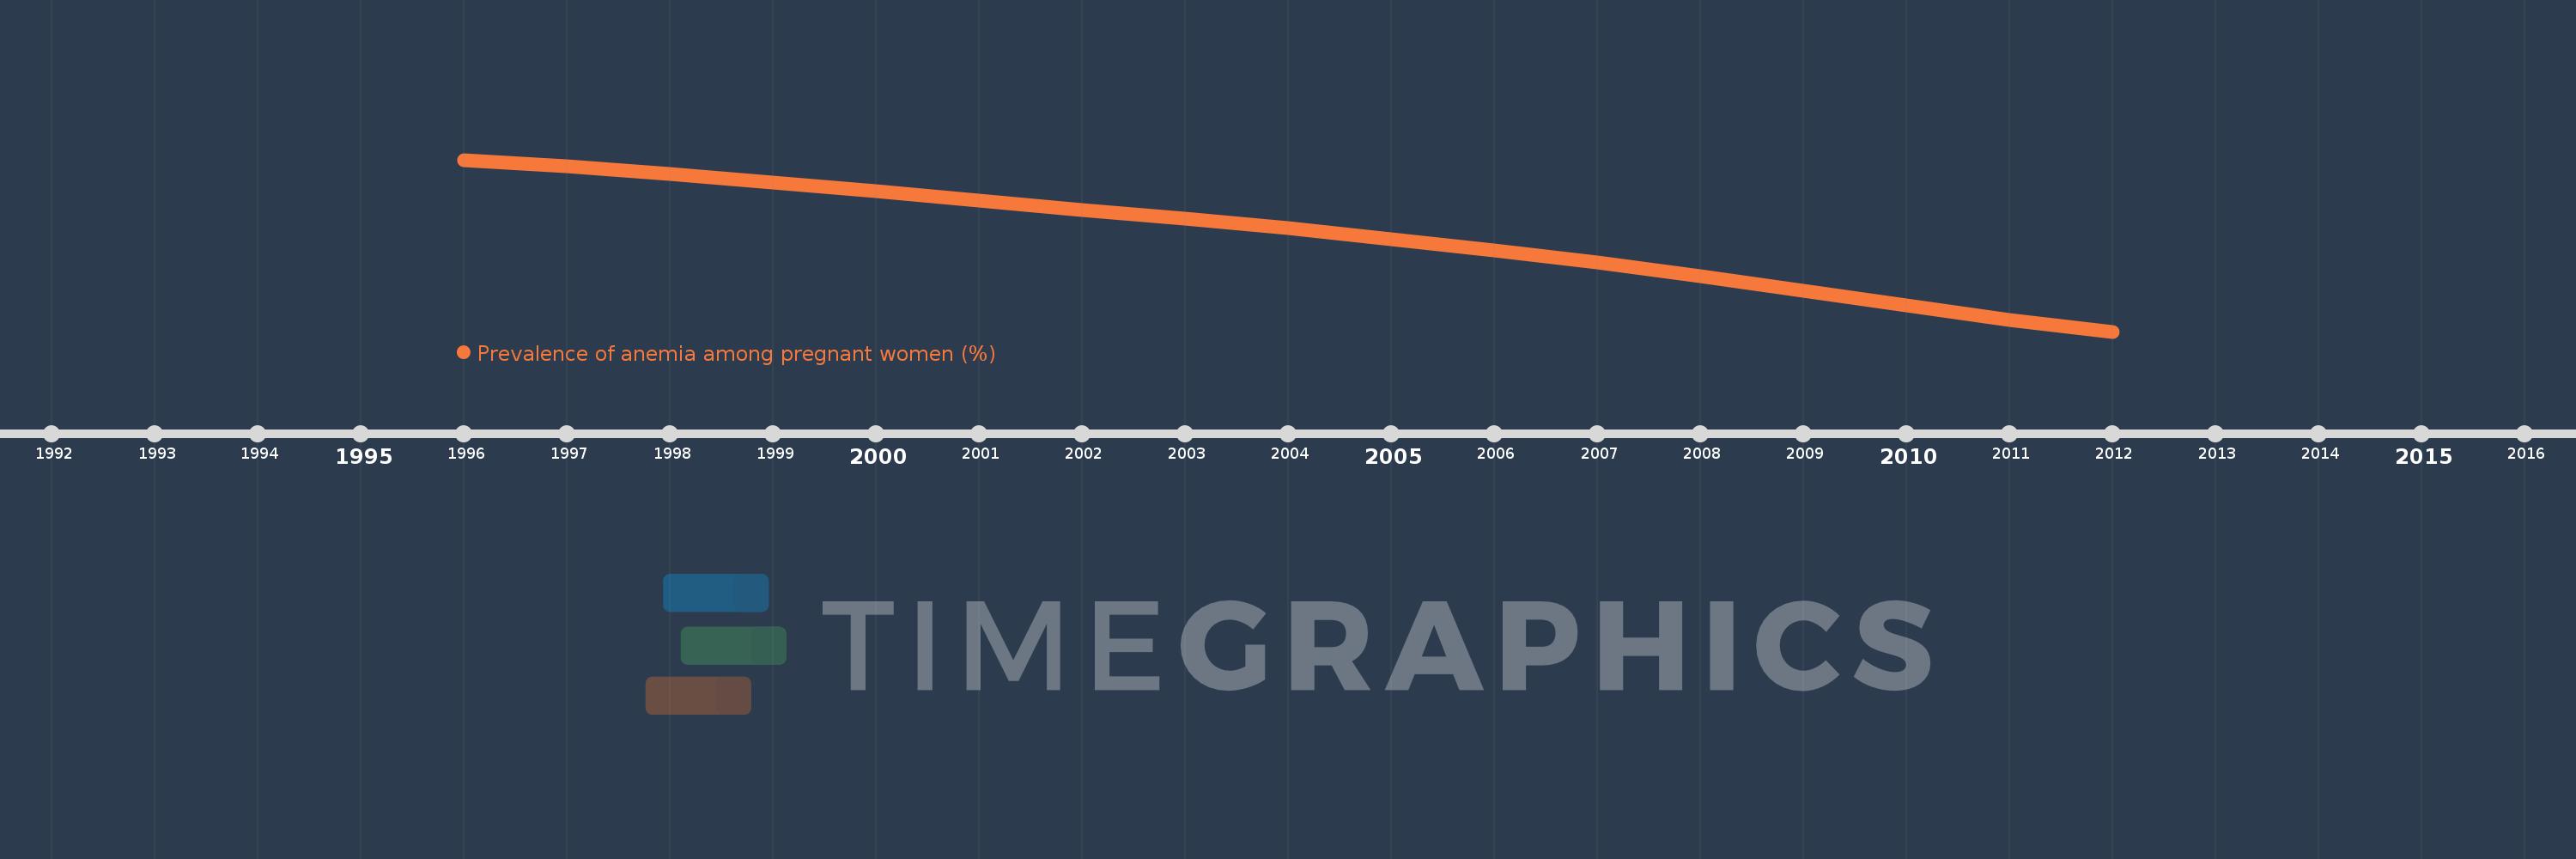
This timeline shows a graph from 1996 to 2012 of Small states. No data until 1995. Number of actual observations by date: 17.
Source name:
World Development Indicators
Source organization:
1. WHO. Global anemia prevalence and trends 1995-2011. Geneva: World Health Organization; forthcoming. 2. Stevens GA, Finucane MM, De-Regil LM, et al. Global, regional, and national trends in hemoglobin concentration and prevalence of total and severe anemia in children and pregnant and non-pregnant women for 1995-2011: a systematic analysis of population-representative data. The Lancet Global Health 2013; 1(1): e16-e25.
Categories, topics:
Health
Last updated:
apr 23, 2017
Indicators value changes by year
Meaning:
40.981
Minimum:
37.221
jan 1, 2012
Maximum:
43.959
jan 1, 1996
At the date of observation
Value
Absolute change
Change from the previous value
jan 1, 1996
43.959
+43.959
0.0%
jan 1, 1997
43.697
-0.262
-0.6%
jan 1, 1998
43.392
-0.305
-0.7%
jan 1, 1999
43.074
-0.318
-0.73%
jan 1, 2000
42.727
-0.347
-0.81%
jan 1, 2001
42.366
-0.36
-0.84%
jan 1, 2002
42.003
-0.364
-0.86%
jan 1, 2003
41.647
-0.356
-0.85%
jan 1, 2004
41.264
-0.383
-0.92%
jan 1, 2005
40.843
-0.421
-1.02%
jan 1, 2006
40.416
-0.428
-1.05%
jan 1, 2007
39.919
-0.496
-1.23%
jan 1, 2008
39.394
-0.526
-1.32%
jan 1, 2009
38.835
-0.558
-1.42%
jan 1, 2010
38.251
-0.585
-1.51%
jan 1, 2011
37.667
-0.583
-1.53%
jan 1, 2012
37.221
-0.446
-1.18%
Ranking of countries by current statistics by years