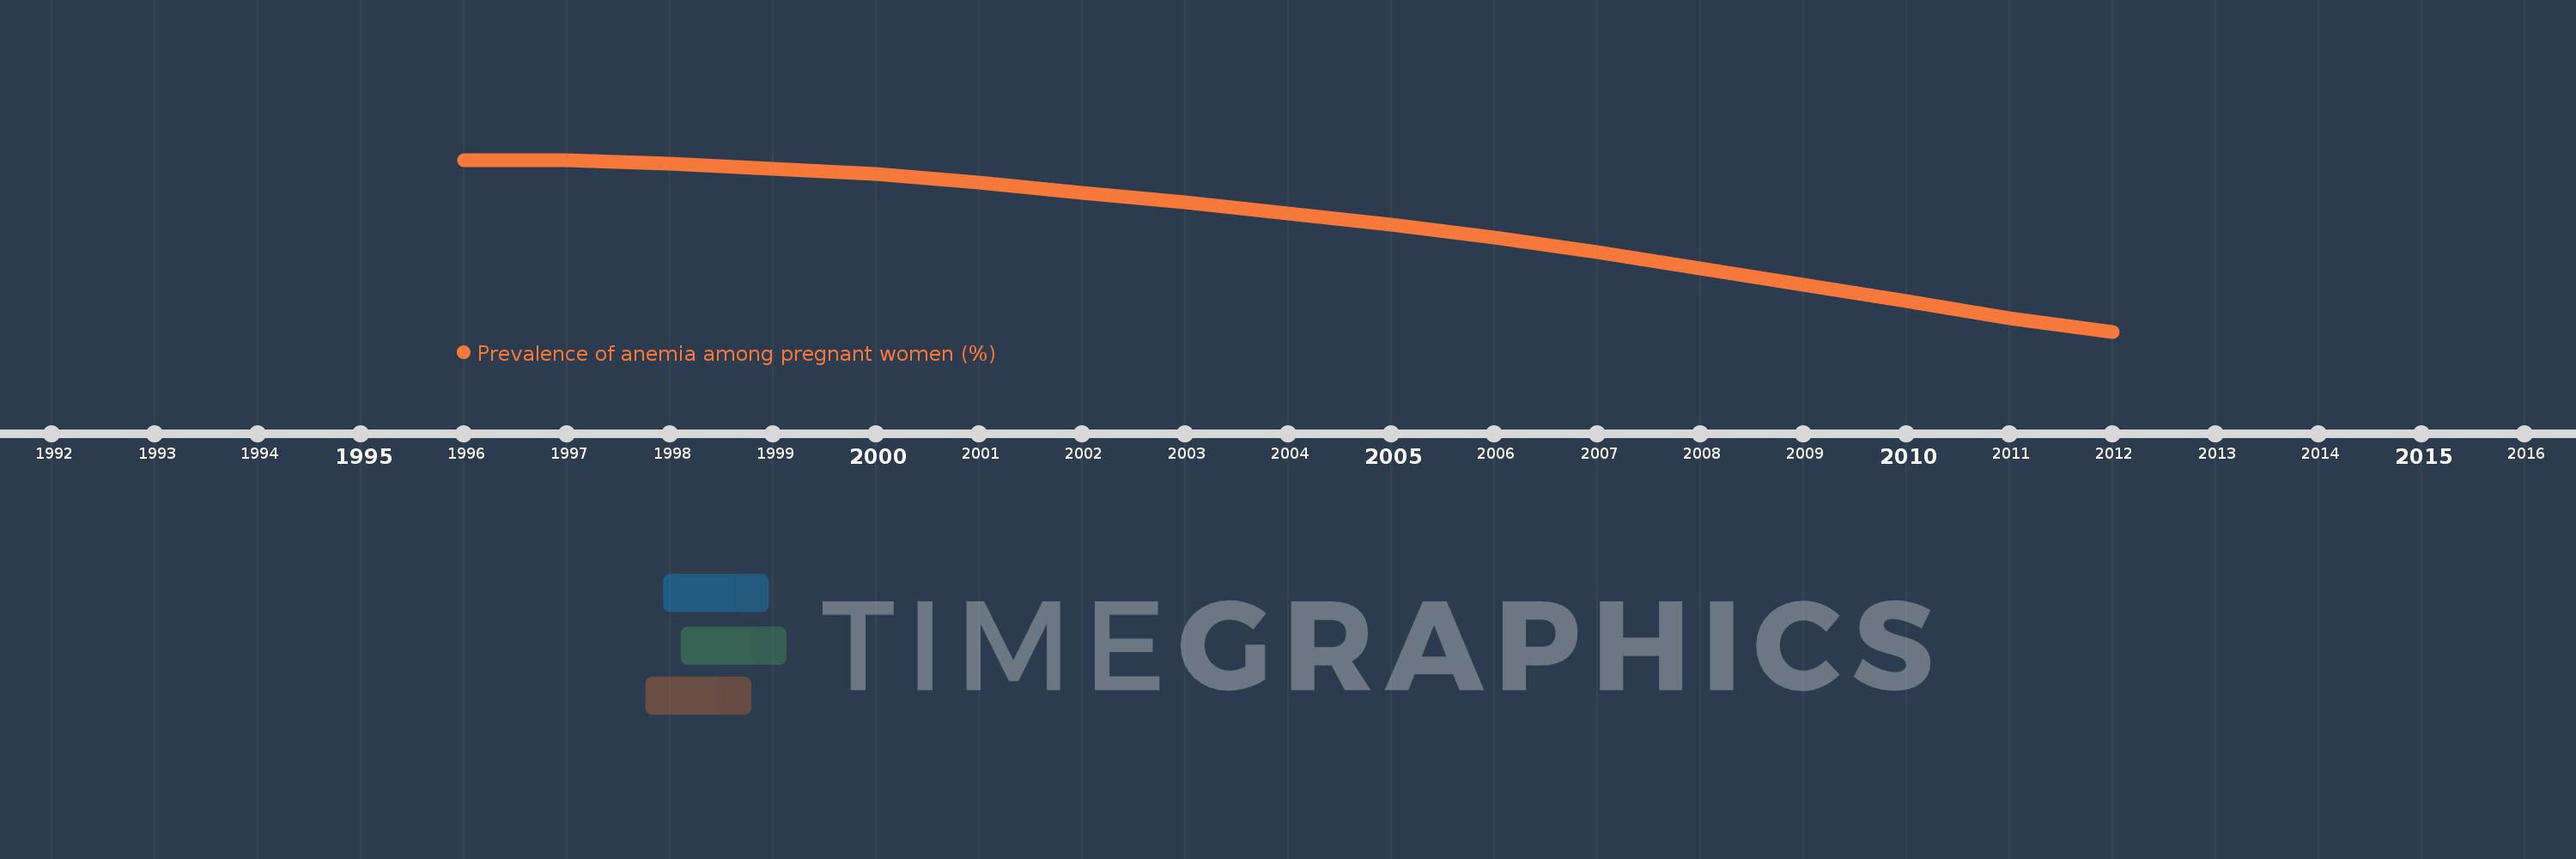
This timeline shows a graph from 1996 to 2012 of IDA & IBRD total. No data until 1995. Number of actual observations by date: 17.
Source name:
World Development Indicators
Source organization:
1. WHO. Global anemia prevalence and trends 1995-2011. Geneva: World Health Organization; forthcoming. 2. Stevens GA, Finucane MM, De-Regil LM, et al. Global, regional, and national trends in hemoglobin concentration and prevalence of total and severe anemia in children and pregnant and non-pregnant women for 1995-2011: a systematic analysis of population-representative data. The Lancet Global Health 2013; 1(1): e16-e25.
Categories, topics:
Health
Last updated:
apr 23, 2017
Indicators value changes by year
Meaning:
42.58
Minimum:
39.467
jan 1, 2012
Maximum:
44.515
jan 1, 1996
At the date of observation
Value
Absolute change
Change from the previous value
jan 1, 1996
44.515
+44.515
0.0%
jan 1, 1997
44.491
-0.024
-0.05%
jan 1, 1998
44.399
-0.092
-0.21%
jan 1, 1999
44.258
-0.141
-0.32%
jan 1, 2000
44.086
-0.172
-0.39%
jan 1, 2001
43.843
-0.243
-0.55%
jan 1, 2002
43.552
-0.292
-0.67%
jan 1, 2003
43.256
-0.296
-0.68%
jan 1, 2004
42.943
-0.313
-0.72%
jan 1, 2005
42.604
-0.339
-0.79%
jan 1, 2006
42.228
-0.375
-0.88%
jan 1, 2007
41.804
-0.425
-1.01%
jan 1, 2008
41.333
-0.47
-1.12%
jan 1, 2009
40.846
-0.487
-1.18%
jan 1, 2010
40.364
-0.482
-1.18%
jan 1, 2011
39.87
-0.494
-1.22%
jan 1, 2012
39.467
-0.403
-1.01%
Ranking of countries by current statistics by years