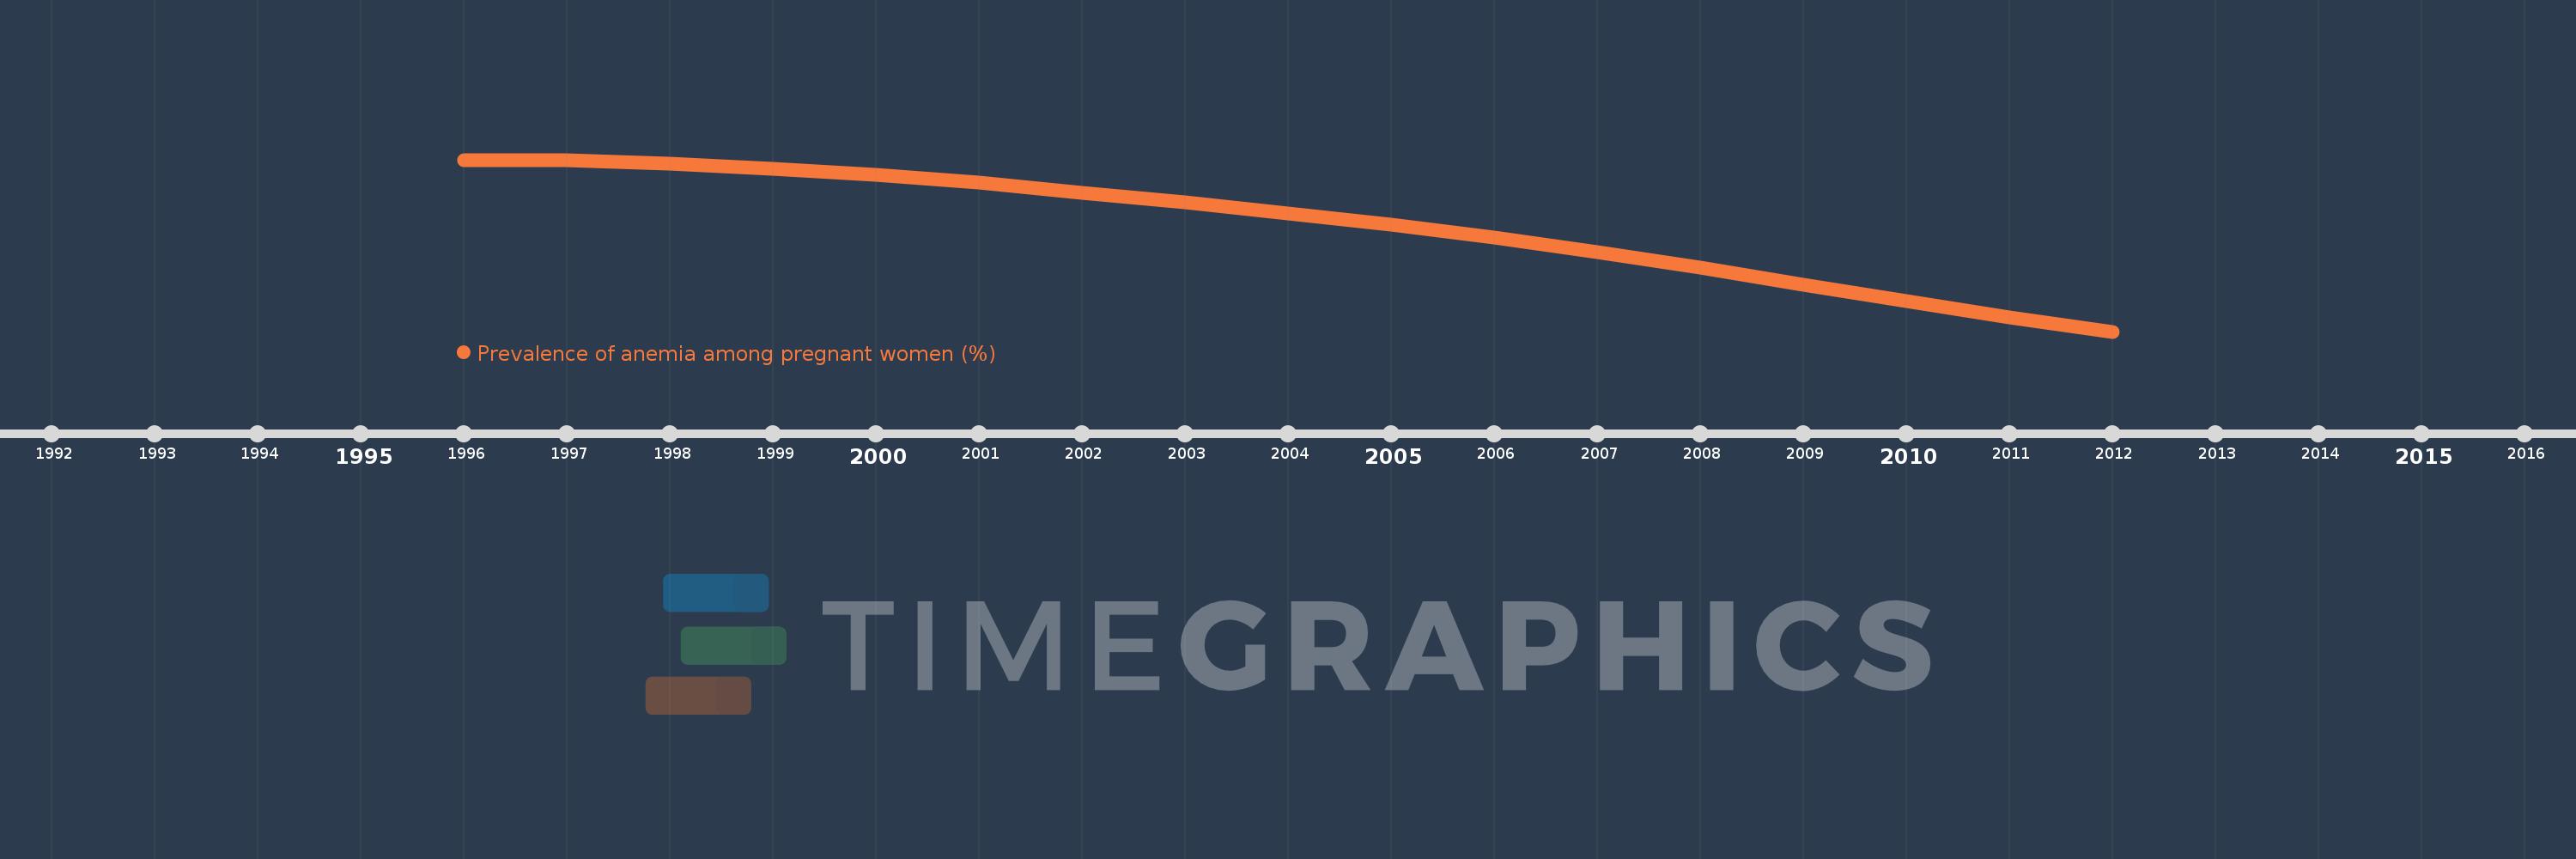
This timeline shows a graph from 1996 to 2012 of Low & middle income. No data until 1995. Number of actual observations by date: 17.
Source name:
World Development Indicators
Source organization:
1. WHO. Global anemia prevalence and trends 1995-2011. Geneva: World Health Organization; forthcoming. 2. Stevens GA, Finucane MM, De-Regil LM, et al. Global, regional, and national trends in hemoglobin concentration and prevalence of total and severe anemia in children and pregnant and non-pregnant women for 1995-2011: a systematic analysis of population-representative data. The Lancet Global Health 2013; 1(1): e16-e25.
Categories, topics:
Health
Last updated:
apr 23, 2017
Indicators value changes by year
Meaning:
42.632
Minimum:
39.505
jan 1, 2012
Maximum:
44.575
jan 1, 1996
At the date of observation
Value
Absolute change
Change from the previous value
jan 1, 1996
44.575
+44.575
0.0%
jan 1, 1997
44.551
-0.024
-0.05%
jan 1, 1998
44.459
-0.092
-0.21%
jan 1, 1999
44.317
-0.142
-0.32%
jan 1, 2000
44.143
-0.173
-0.39%
jan 1, 2001
43.899
-0.244
-0.55%
jan 1, 2002
43.606
-0.293
-0.67%
jan 1, 2003
43.309
-0.297
-0.68%
jan 1, 2004
42.995
-0.314
-0.72%
jan 1, 2005
42.655
-0.34
-0.79%
jan 1, 2006
42.279
-0.376
-0.88%
jan 1, 2007
41.853
-0.426
-1.01%
jan 1, 2008
41.382
-0.471
-1.13%
jan 1, 2009
40.893
-0.489
-1.18%
jan 1, 2010
40.408
-0.484
-1.18%
jan 1, 2011
39.911
-0.497
-1.23%
jan 1, 2012
39.505
-0.406
-1.02%
Ranking of countries by current statistics by years