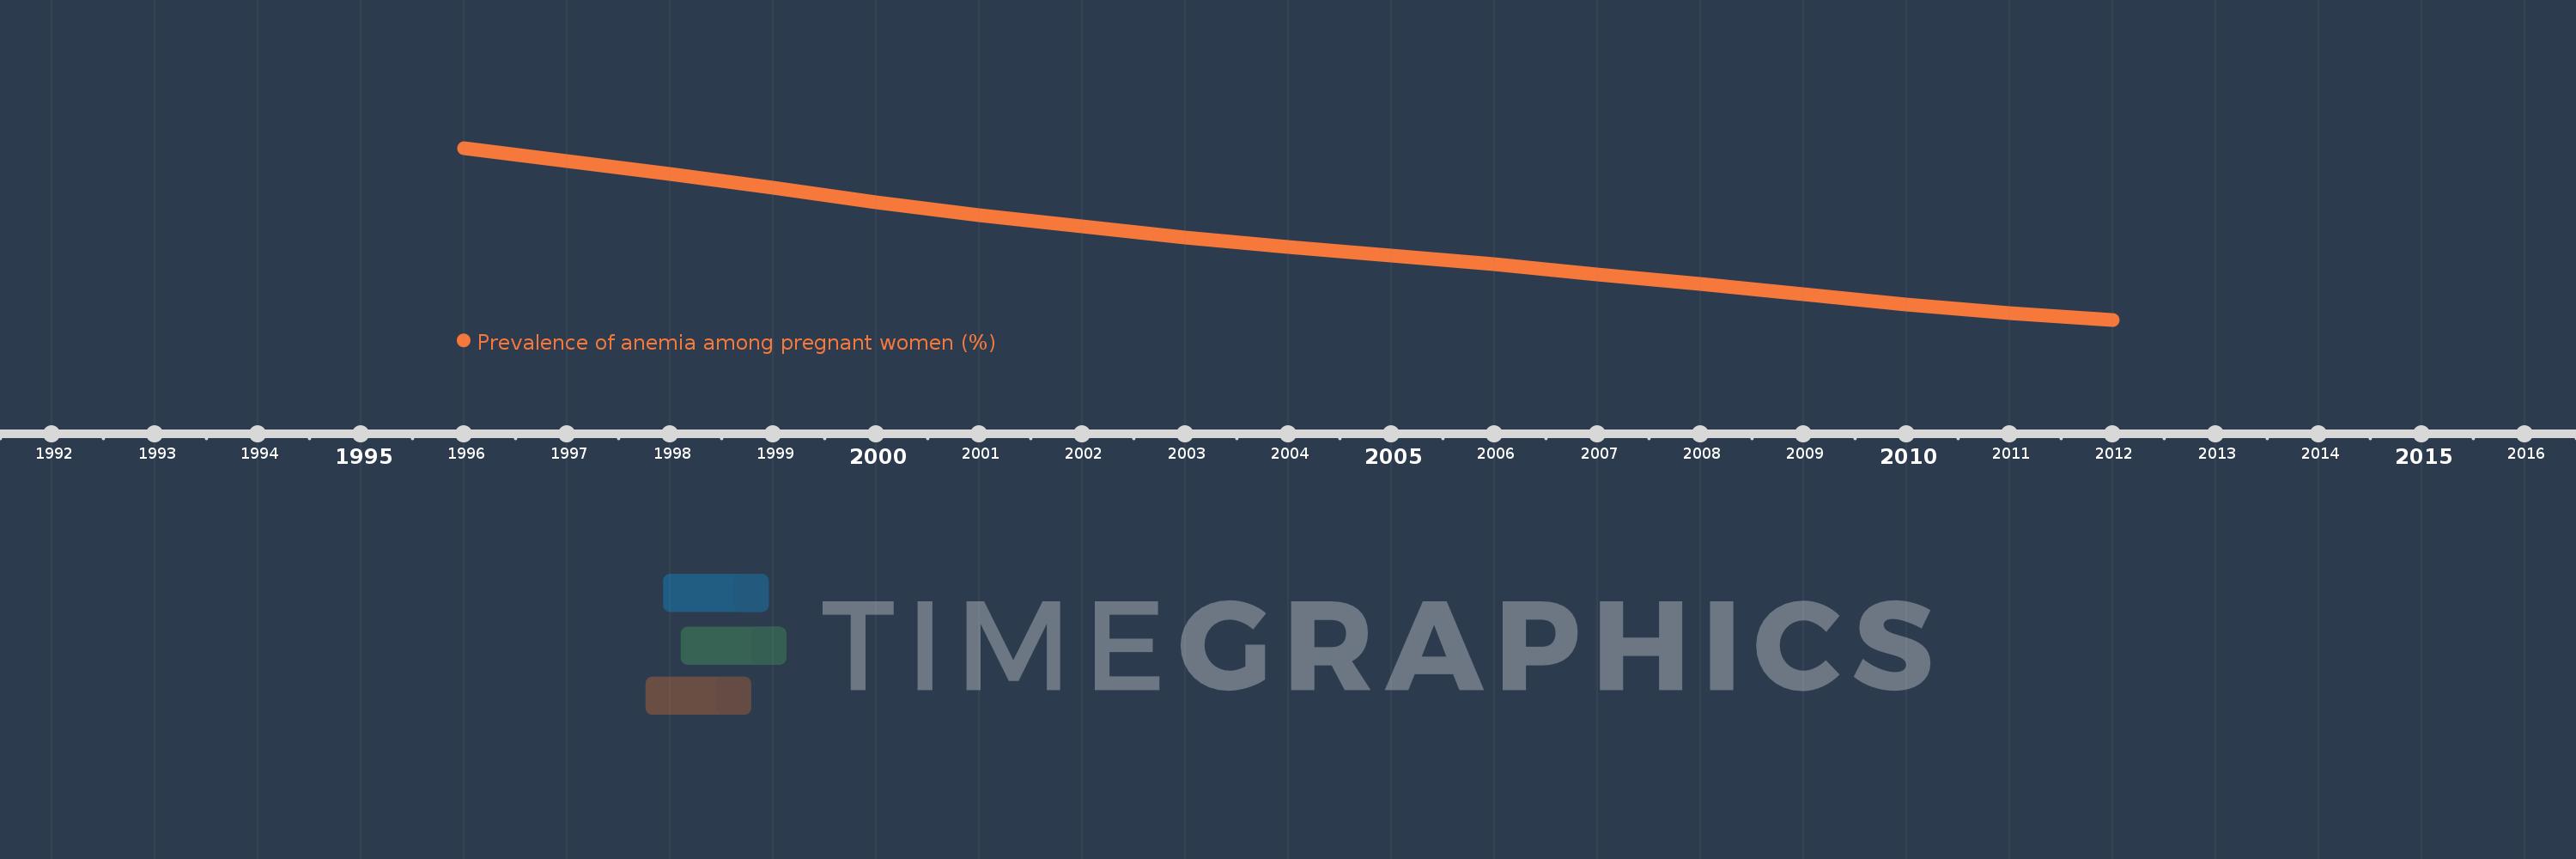
This timeline shows a graph from 1996 to 2012 of Europe & Central Asia (excluding high income). No data until 1995. Number of actual observations by date: 17.
Source name:
World Development Indicators
Source organization:
1. WHO. Global anemia prevalence and trends 1995-2011. Geneva: World Health Organization; forthcoming. 2. Stevens GA, Finucane MM, De-Regil LM, et al. Global, regional, and national trends in hemoglobin concentration and prevalence of total and severe anemia in children and pregnant and non-pregnant women for 1995-2011: a systematic analysis of population-representative data. The Lancet Global Health 2013; 1(1): e16-e25.
Categories, topics:
Health
Last updated:
apr 23, 2017
Indicators value changes by year
Meaning:
30.109
Minimum:
26.854
jan 1, 2012
Maximum:
34.026
jan 1, 1996
At the date of observation
Value
Absolute change
Change from the previous value
jan 1, 1996
34.026
+34.026
0.0%
jan 1, 1997
33.492
-0.534
-1.57%
jan 1, 1998
32.94
-0.552
-1.65%
jan 1, 1999
32.35
-0.59
-1.79%
jan 1, 2000
31.77
-0.58
-1.79%
jan 1, 2001
31.216
-0.554
-1.74%
jan 1, 2002
30.746
-0.47
-1.5%
jan 1, 2003
30.293
-0.453
-1.47%
jan 1, 2004
29.891
-0.403
-1.33%
jan 1, 2005
29.518
-0.373
-1.25%
jan 1, 2006
29.163
-0.355
-1.2%
jan 1, 2007
28.743
-0.42
-1.44%
jan 1, 2008
28.332
-0.411
-1.43%
jan 1, 2009
27.916
-0.417
-1.47%
jan 1, 2010
27.481
-0.435
-1.56%
jan 1, 2011
27.13
-0.351
-1.28%
jan 1, 2012
26.854
-0.277
-1.02%
Ranking of countries by current statistics by years