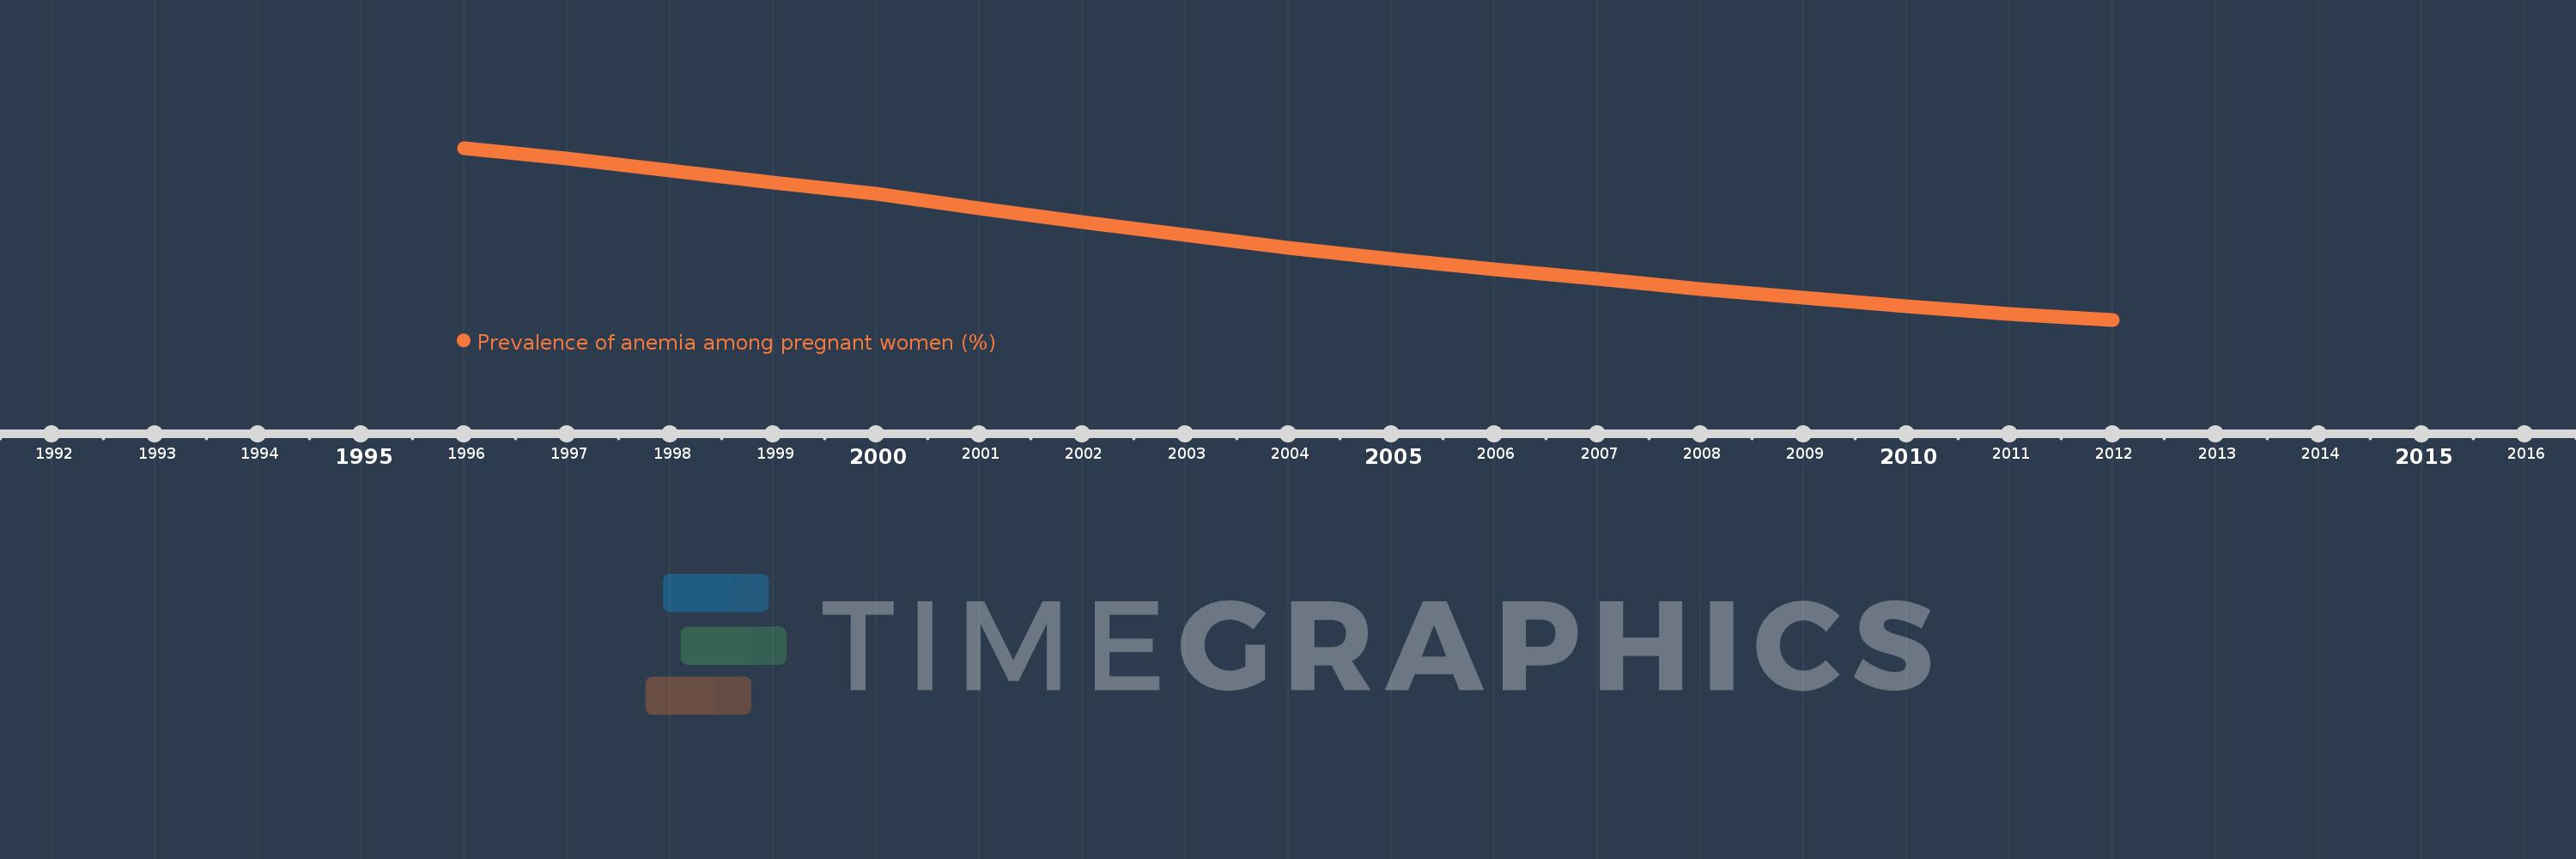
This timeline shows a graph from 1996 to 2012 of East Asia & Pacific (IDA & IBRD countries). No data until 1995. Number of actual observations by date: 17.
Source name:
World Development Indicators
Source organization:
1. WHO. Global anemia prevalence and trends 1995-2011. Geneva: World Health Organization; forthcoming. 2. Stevens GA, Finucane MM, De-Regil LM, et al. Global, regional, and national trends in hemoglobin concentration and prevalence of total and severe anemia in children and pregnant and non-pregnant women for 1995-2011: a systematic analysis of population-representative data. The Lancet Global Health 2013; 1(1): e16-e25.
Categories, topics:
Health
Last updated:
apr 23, 2017
Indicators value changes by year
Meaning:
29.624
Minimum:
25.411
jan 1, 2012
Maximum:
34.608
jan 1, 1996
At the date of observation
Value
Absolute change
Change from the previous value
jan 1, 1996
34.608
+34.608
0.0%
jan 1, 1997
34.06
-0.549
-1.58%
jan 1, 1998
33.405
-0.655
-1.92%
jan 1, 1999
32.777
-0.628
-1.88%
jan 1, 2000
32.136
-0.641
-1.96%
jan 1, 2001
31.376
-0.761
-2.37%
jan 1, 2002
30.651
-0.724
-2.31%
jan 1, 2003
29.963
-0.688
-2.24%
jan 1, 2004
29.28
-0.684
-2.28%
jan 1, 2005
28.685
-0.594
-2.03%
jan 1, 2006
28.128
-0.558
-1.94%
jan 1, 2007
27.594
-0.533
-1.9%
jan 1, 2008
27.072
-0.522
-1.89%
jan 1, 2009
26.605
-0.467
-1.72%
jan 1, 2010
26.149
-0.456
-1.71%
jan 1, 2011
25.712
-0.437
-1.67%
jan 1, 2012
25.411
-0.302
-1.17%
Ranking of countries by current statistics by years