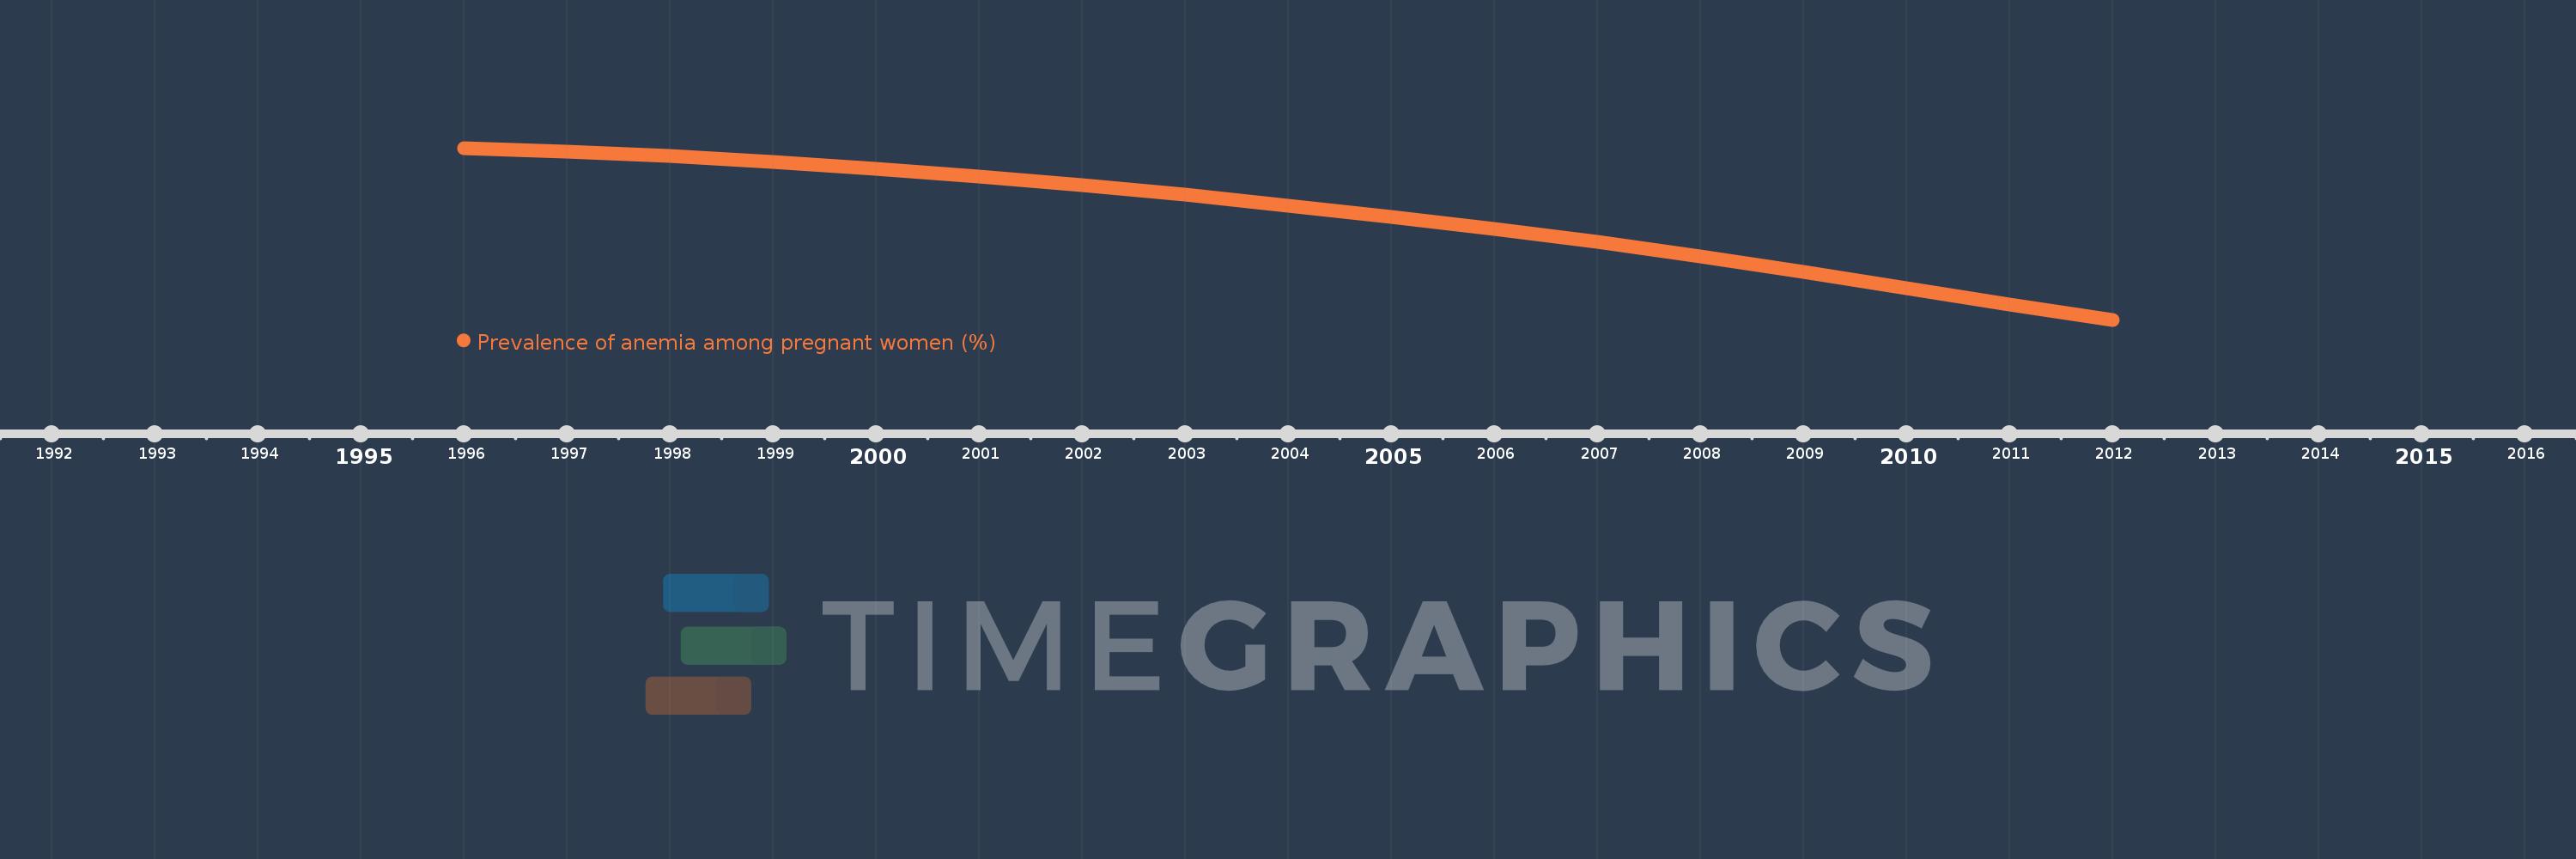
This timeline shows a graph from 1996 to 2012 of IDA only. No data until 1995. Number of actual observations by date: 17.
Source name:
World Development Indicators
Source organization:
1. WHO. Global anemia prevalence and trends 1995-2011. Geneva: World Health Organization; forthcoming. 2. Stevens GA, Finucane MM, De-Regil LM, et al. Global, regional, and national trends in hemoglobin concentration and prevalence of total and severe anemia in children and pregnant and non-pregnant women for 1995-2011: a systematic analysis of population-representative data. The Lancet Global Health 2013; 1(1): e16-e25.
Categories, topics:
Health
Last updated:
apr 23, 2017
Indicators value changes by year
Meaning:
47.953
Minimum:
42.979
jan 1, 2012
Maximum:
51.241
jan 1, 1996
At the date of observation
Value
Absolute change
Change from the previous value
jan 1, 1996
51.241
+51.241
0.0%
jan 1, 1997
51.058
-0.182
-0.36%
jan 1, 1998
50.86
-0.198
-0.39%
jan 1, 1999
50.587
-0.273
-0.54%
jan 1, 2000
50.24
-0.347
-0.69%
jan 1, 2001
49.867
-0.373
-0.74%
jan 1, 2002
49.439
-0.428
-0.86%
jan 1, 2003
48.987
-0.452
-0.91%
jan 1, 2004
48.476
-0.511
-1.04%
jan 1, 2005
47.943
-0.533
-1.1%
jan 1, 2006
47.355
-0.588
-1.23%
jan 1, 2007
46.708
-0.647
-1.37%
jan 1, 2008
46.017
-0.69
-1.48%
jan 1, 2009
45.263
-0.754
-1.64%
jan 1, 2010
44.49
-0.774
-1.71%
jan 1, 2011
43.701
-0.789
-1.77%
jan 1, 2012
42.979
-0.722
-1.65%
Ranking of countries by current statistics by years