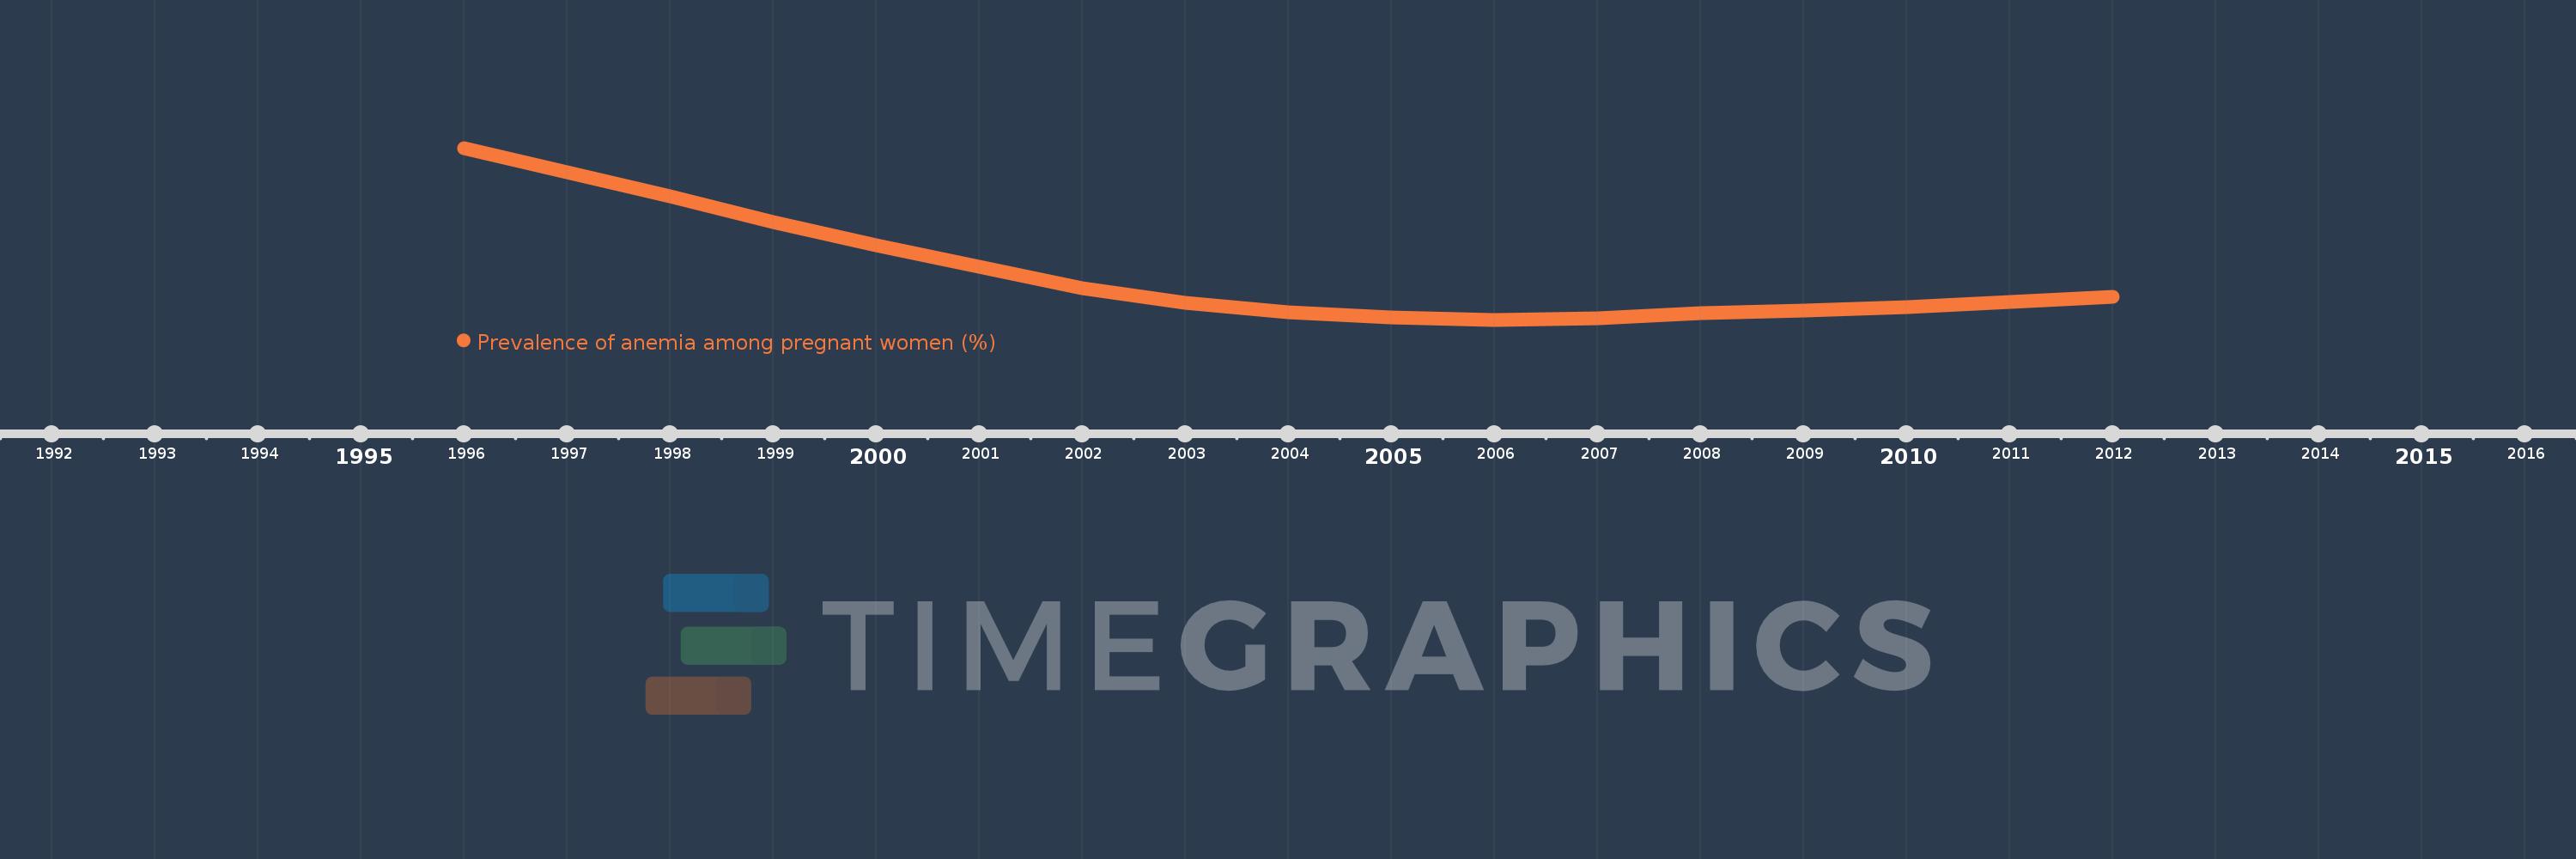
This timeline shows a graph from 1996 to 2012 of OECD members. No data until 1995. Number of actual observations by date: 17.
Source name:
World Development Indicators
Source organization:
1. WHO. Global anemia prevalence and trends 1995-2011. Geneva: World Health Organization; forthcoming. 2. Stevens GA, Finucane MM, De-Regil LM, et al. Global, regional, and national trends in hemoglobin concentration and prevalence of total and severe anemia in children and pregnant and non-pregnant women for 1995-2011: a systematic analysis of population-representative data. The Lancet Global Health 2013; 1(1): e16-e25.
Categories, topics:
Health
Last updated:
apr 23, 2017
Indicators value changes by year
Meaning:
23.13
Minimum:
22.153
jan 1, 2006
Maximum:
25.732
jan 1, 1996
At the date of observation
Value
Absolute change
Change from the previous value
jan 1, 1996
25.732
+25.732
0.0%
jan 1, 1997
25.234
-0.499
-1.94%
jan 1, 1998
24.732
-0.502
-1.99%
jan 1, 1999
24.194
-0.538
-2.18%
jan 1, 2000
23.713
-0.48
-1.99%
jan 1, 2001
23.253
-0.46
-1.94%
jan 1, 2002
22.813
-0.44
-1.89%
jan 1, 2003
22.499
-0.315
-1.38%
jan 1, 2004
22.3
-0.199
-0.88%
jan 1, 2005
22.197
-0.103
-0.46%
jan 1, 2006
22.153
-0.044
-0.2%
jan 1, 2007
22.189
+0.036
0.16%
jan 1, 2008
22.283
+0.093
0.42%
jan 1, 2009
22.349
+0.067
0.3%
jan 1, 2010
22.413
+0.063
0.28%
jan 1, 2011
22.516
+0.103
0.46%
jan 1, 2012
22.637
+0.122
0.54%
Ranking of countries by current statistics by years