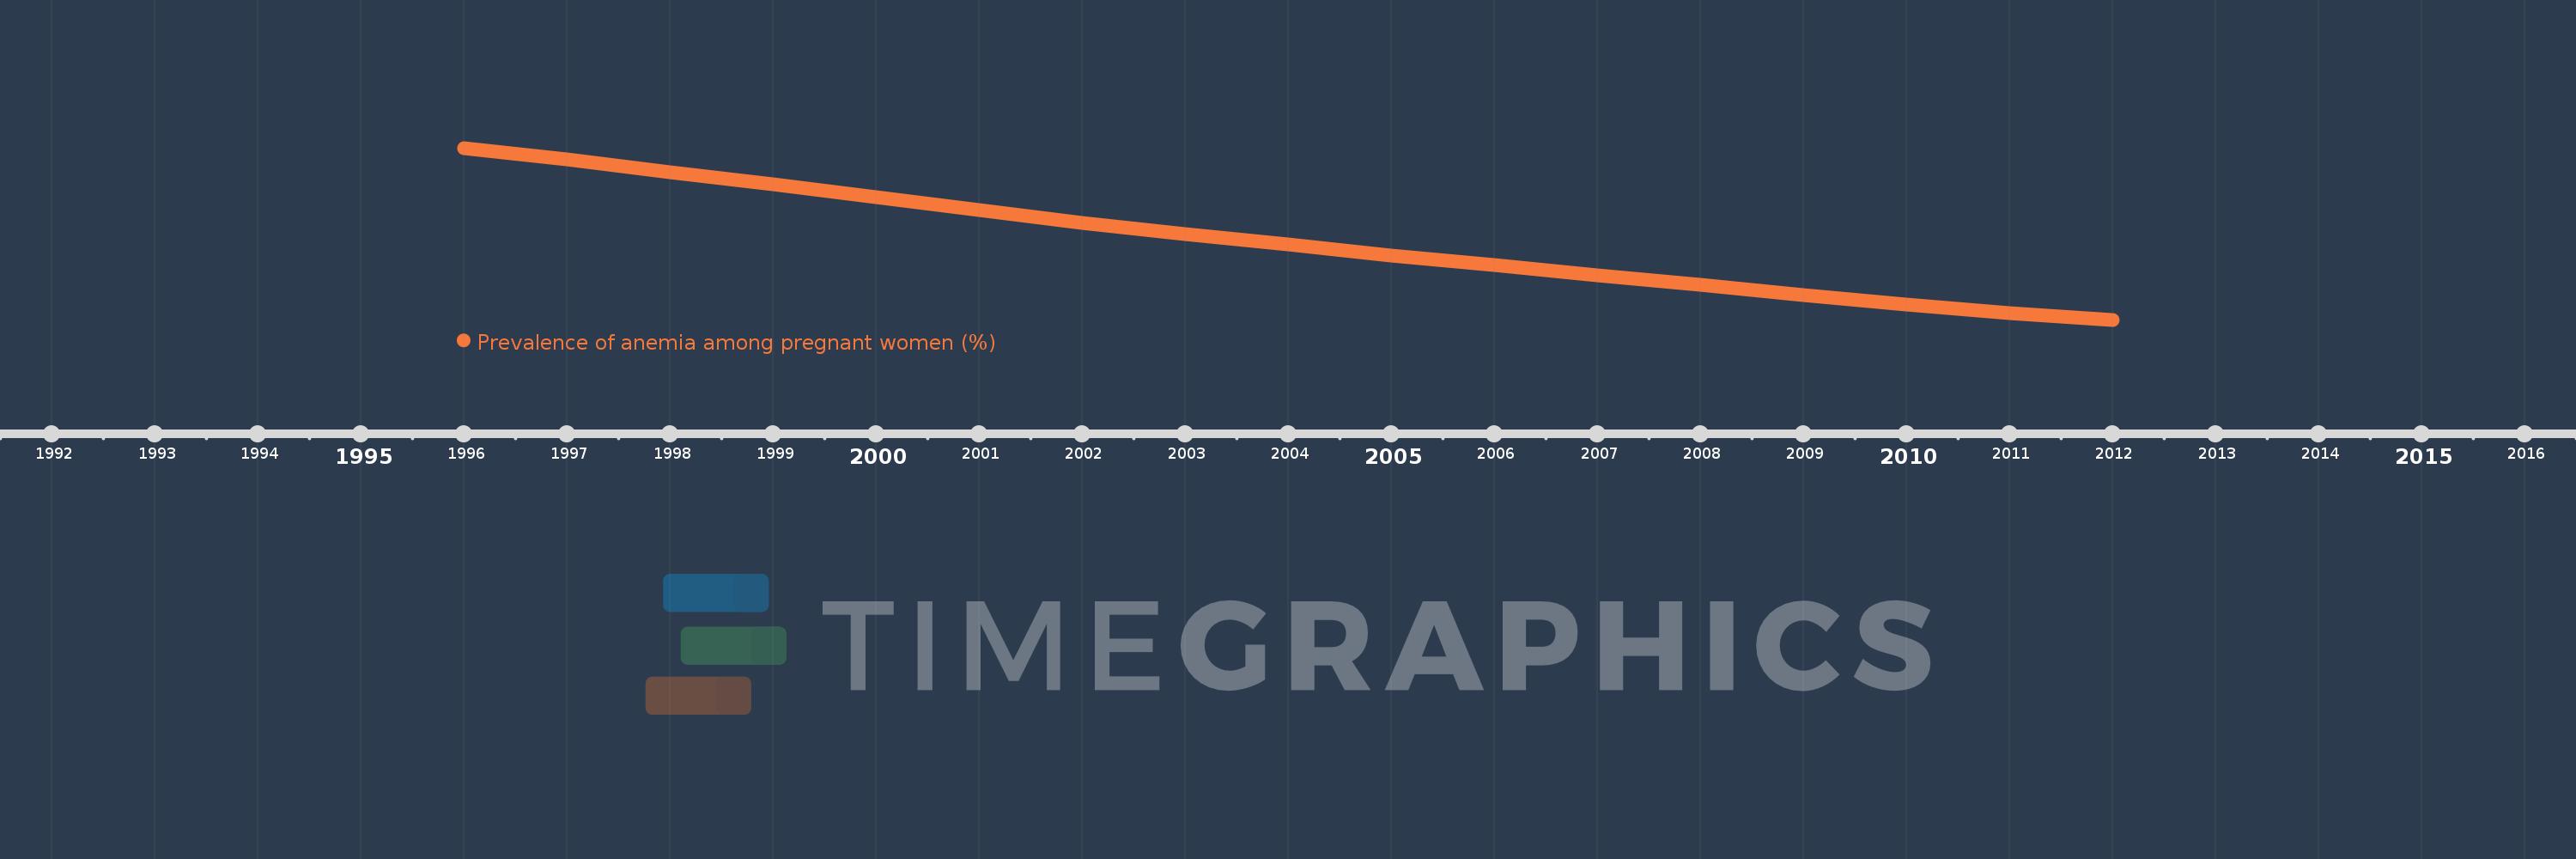
This timeline shows a graph from 1996 to 2012 of Pacific island small states. No data until 1995. Number of actual observations by date: 17.
Source name:
World Development Indicators
Source organization:
1. WHO. Global anemia prevalence and trends 1995-2011. Geneva: World Health Organization; forthcoming. 2. Stevens GA, Finucane MM, De-Regil LM, et al. Global, regional, and national trends in hemoglobin concentration and prevalence of total and severe anemia in children and pregnant and non-pregnant women for 1995-2011: a systematic analysis of population-representative data. The Lancet Global Health 2013; 1(1): e16-e25.
Categories, topics:
Health
Last updated:
apr 23, 2017
Indicators value changes by year
Meaning:
37.752
Minimum:
31.27
jan 1, 2012
Maximum:
45.312
jan 1, 1996
At the date of observation
Value
Absolute change
Change from the previous value
jan 1, 1996
45.312
+45.312
0.0%
jan 1, 1997
44.374
-0.938
-2.07%
jan 1, 1998
43.327
-1.046
-2.36%
jan 1, 1999
42.327
-1.0
-2.31%
jan 1, 2000
41.254
-1.073
-2.53%
jan 1, 2001
40.215
-1.04
-2.52%
jan 1, 2002
39.215
-1.0
-2.49%
jan 1, 2003
38.304
-0.911
-2.32%
jan 1, 2004
37.395
-0.909
-2.37%
jan 1, 2005
36.517
-0.877
-2.35%
jan 1, 2006
35.71
-0.807
-2.21%
jan 1, 2007
34.906
-0.804
-2.25%
jan 1, 2008
34.097
-0.809
-2.32%
jan 1, 2009
33.272
-0.824
-2.42%
jan 1, 2010
32.507
-0.765
-2.3%
jan 1, 2011
31.786
-0.722
-2.22%
jan 1, 2012
31.27
-0.516
-1.62%
Ranking of countries by current statistics by years