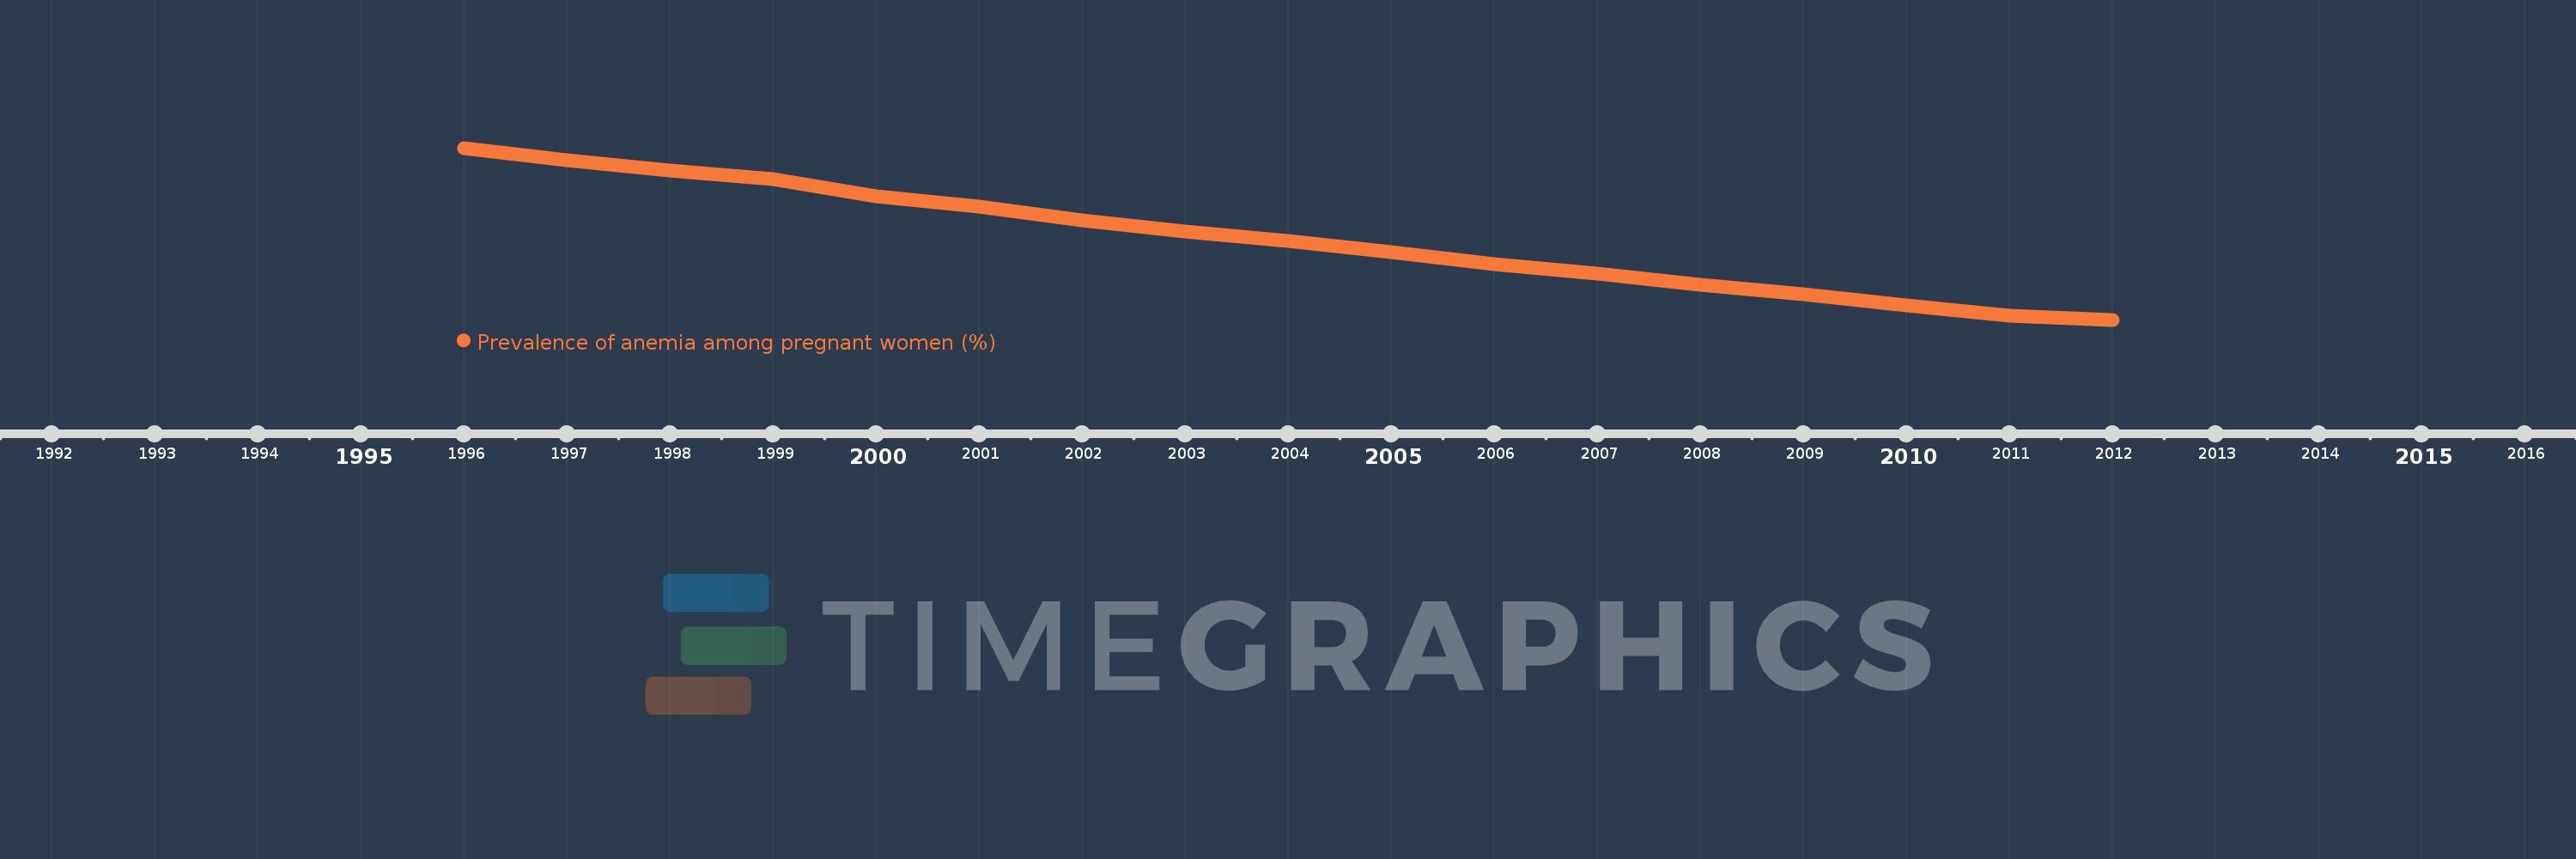
This timeline shows a graph from 1996 to 2012 of IDA blend. No data until 1995. Number of actual observations by date: 17.
Source name:
World Development Indicators
Source organization:
1. WHO. Global anemia prevalence and trends 1995-2011. Geneva: World Health Organization; forthcoming. 2. Stevens GA, Finucane MM, De-Regil LM, et al. Global, regional, and national trends in hemoglobin concentration and prevalence of total and severe anemia in children and pregnant and non-pregnant women for 1995-2011: a systematic analysis of population-representative data. The Lancet Global Health 2013; 1(1): e16-e25.
Categories, topics:
Health
Last updated:
apr 23, 2017
Indicators value changes by year
Meaning:
50.052
Minimum:
48.709
jan 1, 2012
Maximum:
51.568
jan 1, 1996
At the date of observation
Value
Absolute change
Change from the previous value
jan 1, 1996
51.568
+51.568
0.0%
jan 1, 1997
51.364
-0.204
-0.4%
jan 1, 1998
51.199
-0.165
-0.32%
jan 1, 1999
51.042
-0.157
-0.31%
jan 1, 2000
50.767
-0.275
-0.54%
jan 1, 2001
50.592
-0.175
-0.34%
jan 1, 2002
50.369
-0.223
-0.44%
jan 1, 2003
50.173
-0.196
-0.39%
jan 1, 2004
50.019
-0.153
-0.31%
jan 1, 2005
49.832
-0.187
-0.37%
jan 1, 2006
49.641
-0.191
-0.38%
jan 1, 2007
49.47
-0.171
-0.34%
jan 1, 2008
49.291
-0.18
-0.36%
jan 1, 2009
49.137
-0.154
-0.31%
jan 1, 2010
48.947
-0.19
-0.39%
jan 1, 2011
48.771
-0.176
-0.36%
jan 1, 2012
48.709
-0.062
-0.13%
Ranking of countries by current statistics by years