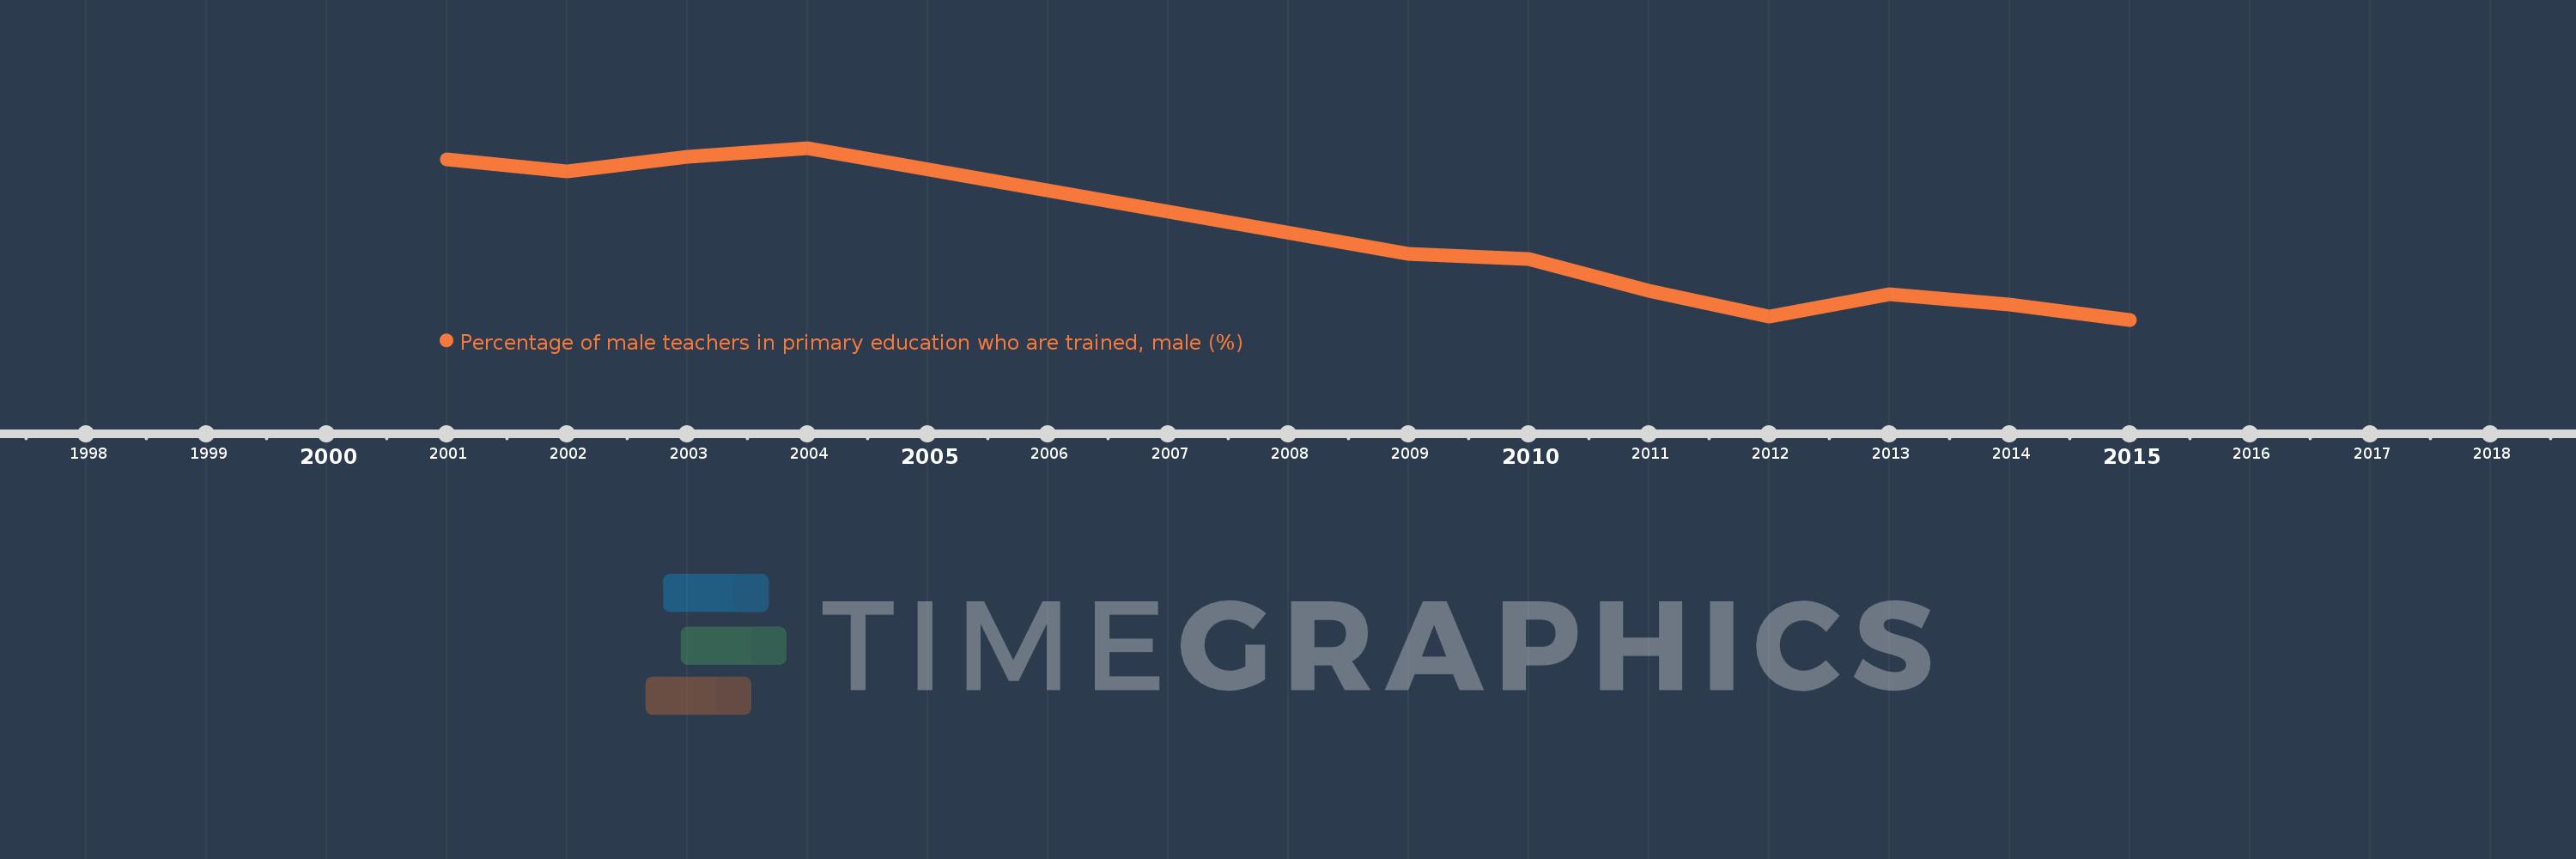
This timeline shows a graph from 2001 to 2015 of Fragile and conflict affected situations. No data until 2000. Number of actual observations by date: 11.
Source name:
World Development Indicators
Source organization:
United Nations Educational, Scientific, and Cultural Organization (UNESCO) Institute for Statistics.
Categories, topics:
Education, Gender
Last updated:
apr 23, 2017
Indicators value changes by year
Meaning:
78.888
Minimum:
75.143
jan 1, 2015
Maximum:
83.535
jan 1, 2004
At the date of observation
Value
Absolute change
Change from the previous value
jan 1, 2001
82.983
+82.983
0.0%
jan 1, 2002
82.393
-0.589
-0.71%
jan 1, 2003
83.105
+0.711
0.86%
jan 1, 2004
83.535
+0.431
0.52%
jan 1, 2009
78.349
-5.186
-6.21%
jan 1, 2010
78.099
-0.25
-0.32%
jan 1, 2011
76.56
-1.539
-1.97%
jan 1, 2012
75.3
-1.26
-1.65%
jan 1, 2013
76.4
+1.1
1.46%
jan 1, 2014
75.904
-0.496
-0.65%
jan 1, 2015
75.143
-0.762
-1.0%
Ranking of countries by current statistics by years