Download This statistics in other country:
Timeline:
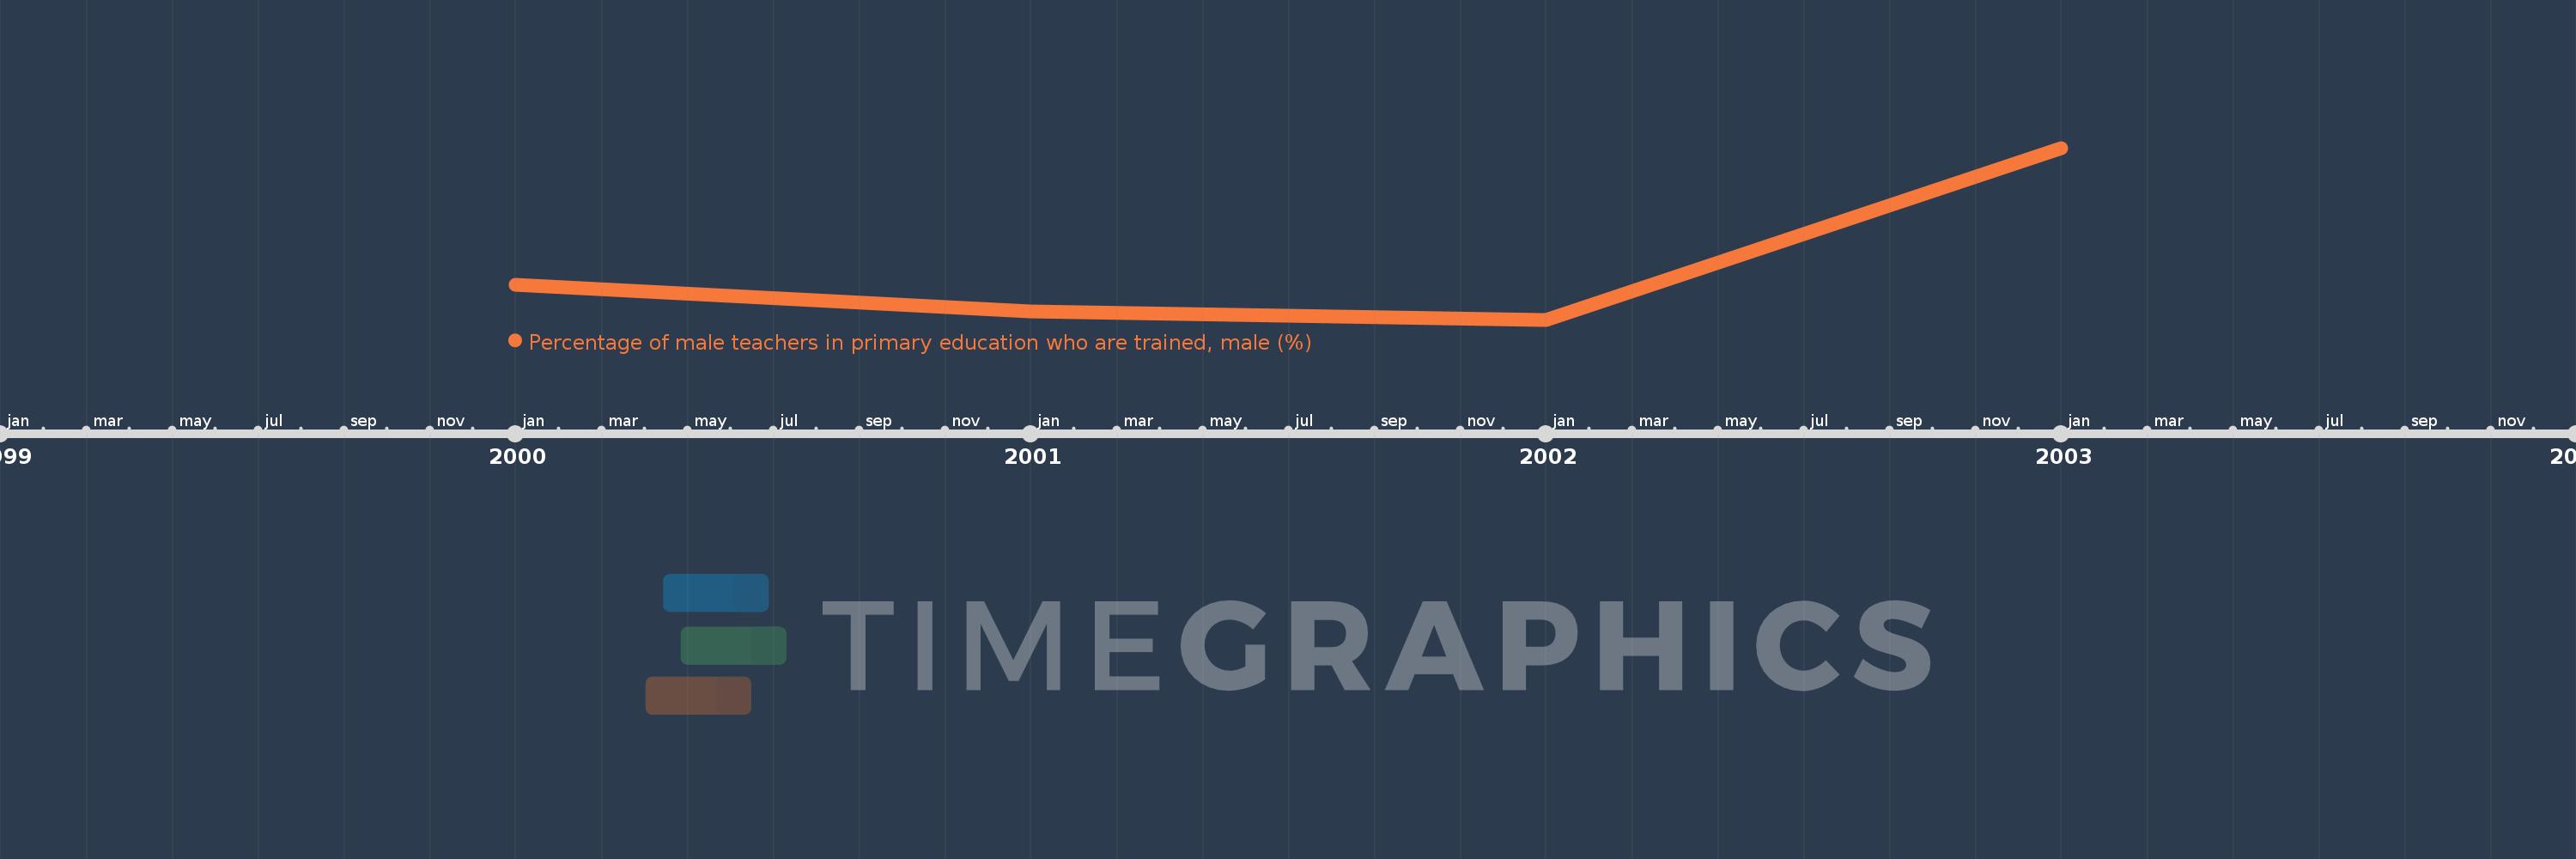
This timeline shows a graph from 2000 to 2003 of South Africa. No data until 1999. Number of actual observations by date: 4.
Source name:
World Development Indicators
Source organization:
United Nations Educational, Scientific, and Cultural Organization (UNESCO) Institute for Statistics.
Categories, topics:
Education, Gender
Last updated:
apr 23, 2017
Indicators value changes by year
Minimum:
60.641
jan 1, 2002
Maximum:
87.228
jan 1, 2003
At the date of observation
Value
Absolute change
Change from the previous value
jan 1, 2000
66.0
+66.0
0.0%
jan 1, 2001
61.958
-4.041
-6.12%
jan 1, 2002
60.641
-1.317
-2.13%
jan 1, 2003
87.228
+26.587
43.84%
Ranking of countries by current statistics by years