Download This statistics in other country:
Timeline:
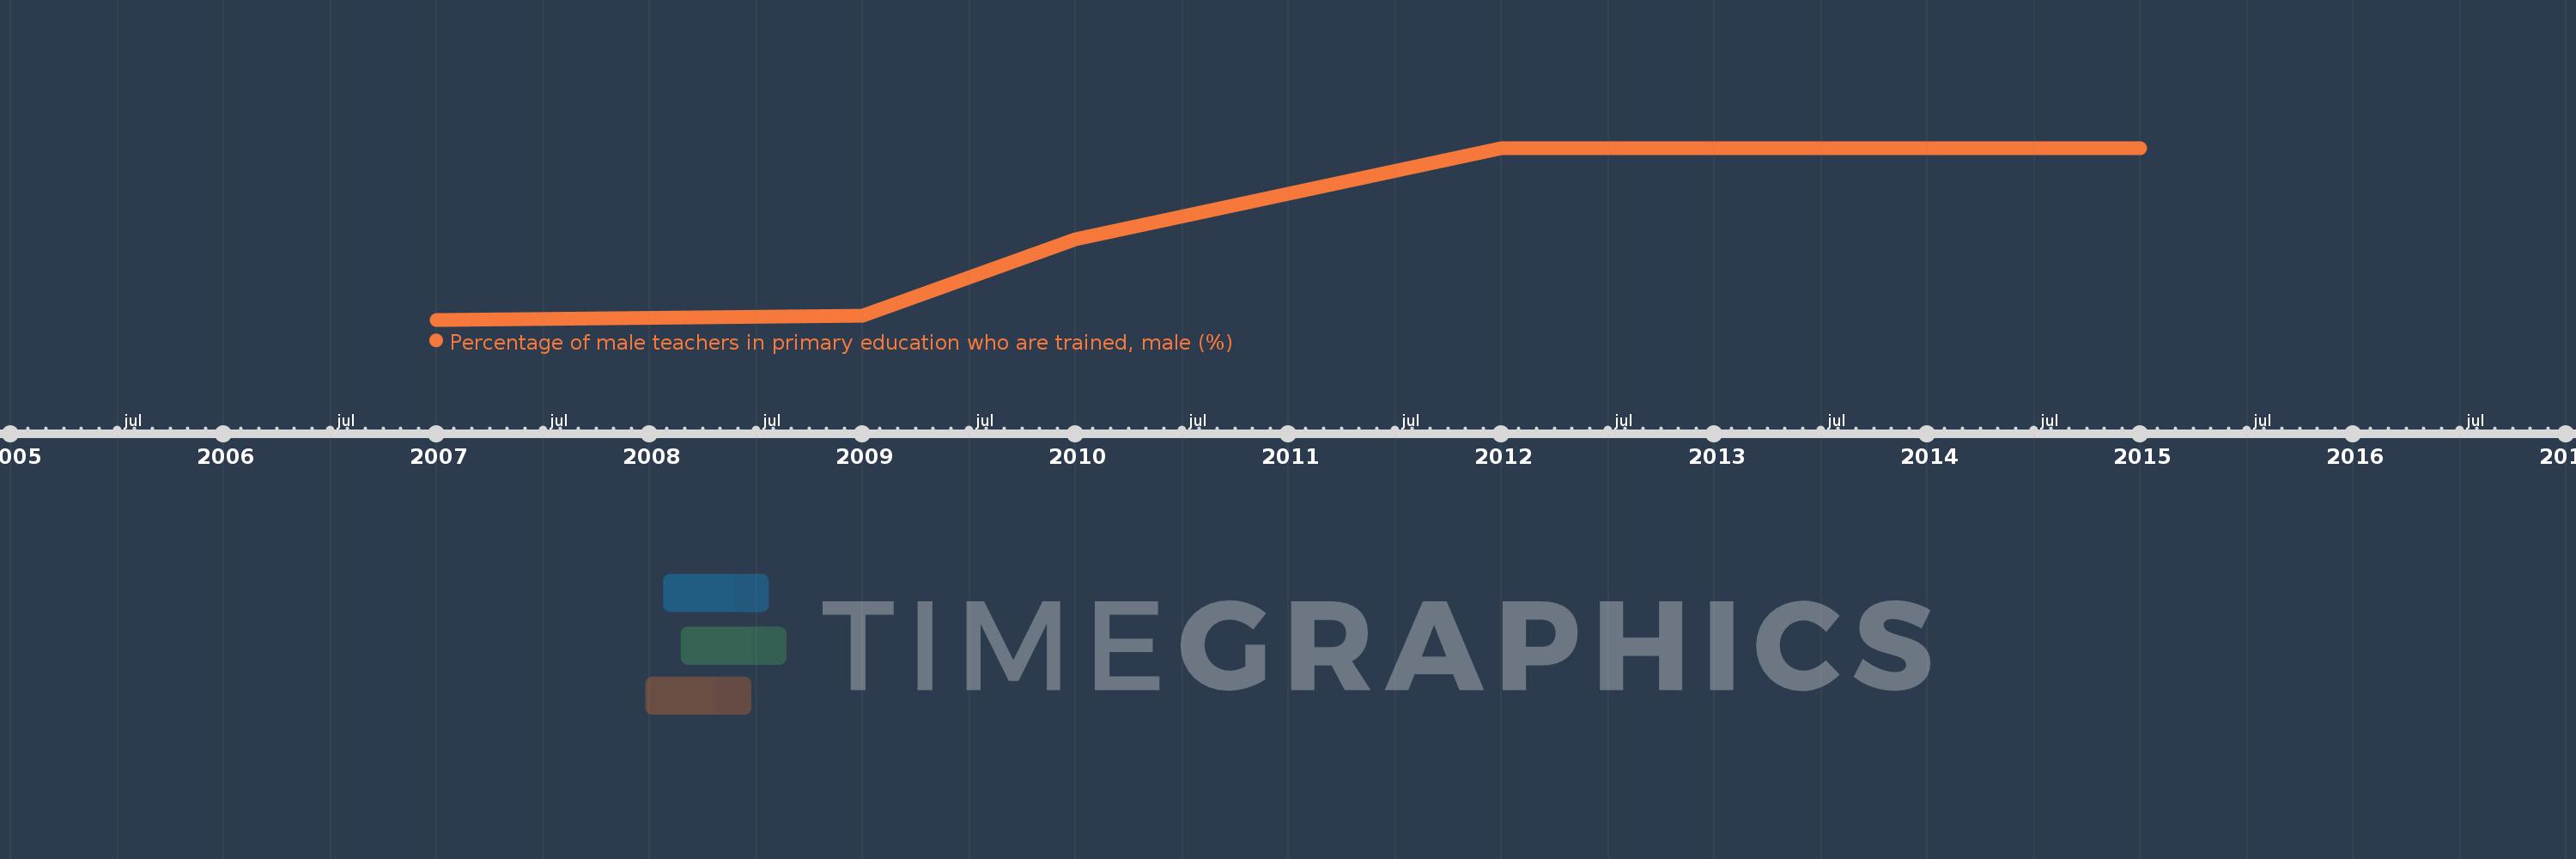
This timeline shows a graph from 2007 to 2015 of Liberia. No data until 2006. Number of actual observations by date: 5.
Source name:
World Development Indicators
Source organization:
United Nations Educational, Scientific, and Cultural Organization (UNESCO) Institute for Statistics.
Categories, topics:
Education, Gender
Last updated:
apr 23, 2017
Indicators value changes by year
Maximum:
55.332
jan 1, 2015
At the date of observation
Value
Absolute change
Change from the previous value
jan 1, 2007
38.81
+38.81
0.0%
jan 1, 2009
39.179
+0.369
0.95%
jan 1, 2010
46.544
+7.365
18.8%
jan 1, 2012
55.323
+8.78
18.86%
jan 1, 2015
55.332
+0.008
0.02%
Ranking of countries by current statistics by years