29
/
en
AIzaSyAYiBZKx7MnpbEhh9jyipgxe19OcubqV5w
April 1, 2024
283161
Virgin Islands (U.S.)
VIR
true
2
1
Adjusted savings: education expenditure (current US$)
1990,1989,1988,1987,1986,1985,1984,1983,1982,1981,1980,1979,1978,1977,1976,1975,1974,1973,1972,1971
Download
Global statistics library →Virgin Islands (U.S.) →

Adjusted savings: education expenditure (current US$)

This statistics in other country:
AfghanistanAlbaniaAlgeriaAmerican SamoaAndorraAngolaAntigua and BarbudaArgentinaArmeniaAustraliaAustriaAzerbaijanBahamas, TheBahrainBangladeshBarbadosBelarusBelgiumBelizeBeninBermudaBhutanBoliviaBotswanaBrazilBrunei DarussalamBulgariaBurkina FasoBurundiCabo VerdeCambodiaCameroonCanadaCentral African RepublicChadChileChinaColombiaComorosCongo, Dem. Rep.Congo, Rep.Costa RicaCote d'IvoireCroatiaCubaCyprusCzech RepublicDenmarkDjiboutiDominicaDominican RepublicEcuadorEgypt, Arab Rep.El SalvadorEquatorial GuineaEritreaEstoniaEthiopiaFijiFinlandFranceFrench PolynesiaGabonGambia, TheGeorgiaGermanyGhanaGreeceGrenadaGuatemalaGuineaGuinea-BissauGuyanaHaitiHondurasHong Kong SAR, ChinaHungaryIcelandIndiaIndonesiaIran, Islamic Rep.IraqIrelandIsraelItalyJamaicaJapanJordanKazakhstanKenyaKiribatiKorea, Rep.KuwaitKyrgyz RepublicLao PDRLatviaLebanonLesothoLiberiaLibyaLiechtensteinLithuaniaLuxembourgMacao SAR, ChinaMacedonia, FYRMadagascarMalawiMalaysiaMaldivesMaliMaltaMarshall IslandsMauritaniaMauritiusMexicoMicronesia, Fed. Sts.MoldovaMonacoMongoliaMoroccoMozambiqueMyanmarNamibiaNepalNetherlandsNew CaledoniaNew ZealandNicaraguaNigerNigeriaNorwayOmanPakistanPanamaPapua New GuineaParaguayPeruPhilippinesPolandPortugalPuerto RicoQatarRomaniaRussian FederationRwandaSamoaSan MarinoSao Tome and PrincipeSaudi ArabiaSenegalSerbiaSeychellesSierra LeoneSingaporeSlovak RepublicSloveniaSolomon IslandsSomaliaSouth AfricaSpainSri LankaSt. Kitts and NevisSt. LuciaSt. Vincent and the GrenadinesSudanSurinameSwazilandSwedenSwitzerlandSyrian Arab RepublicTajikistanTanzaniaThailandTimor-LesteTogoTongaTrinidad and TobagoTunisiaTurkeyTurkmenistanUgandaUkraineUnited KingdomUnited StatesUruguayUzbekistanVanuatuVenezuela, RBVietnamVirgin Islands (U.S.)Yemen, Rep.ZambiaZimbabwe
Timeline:
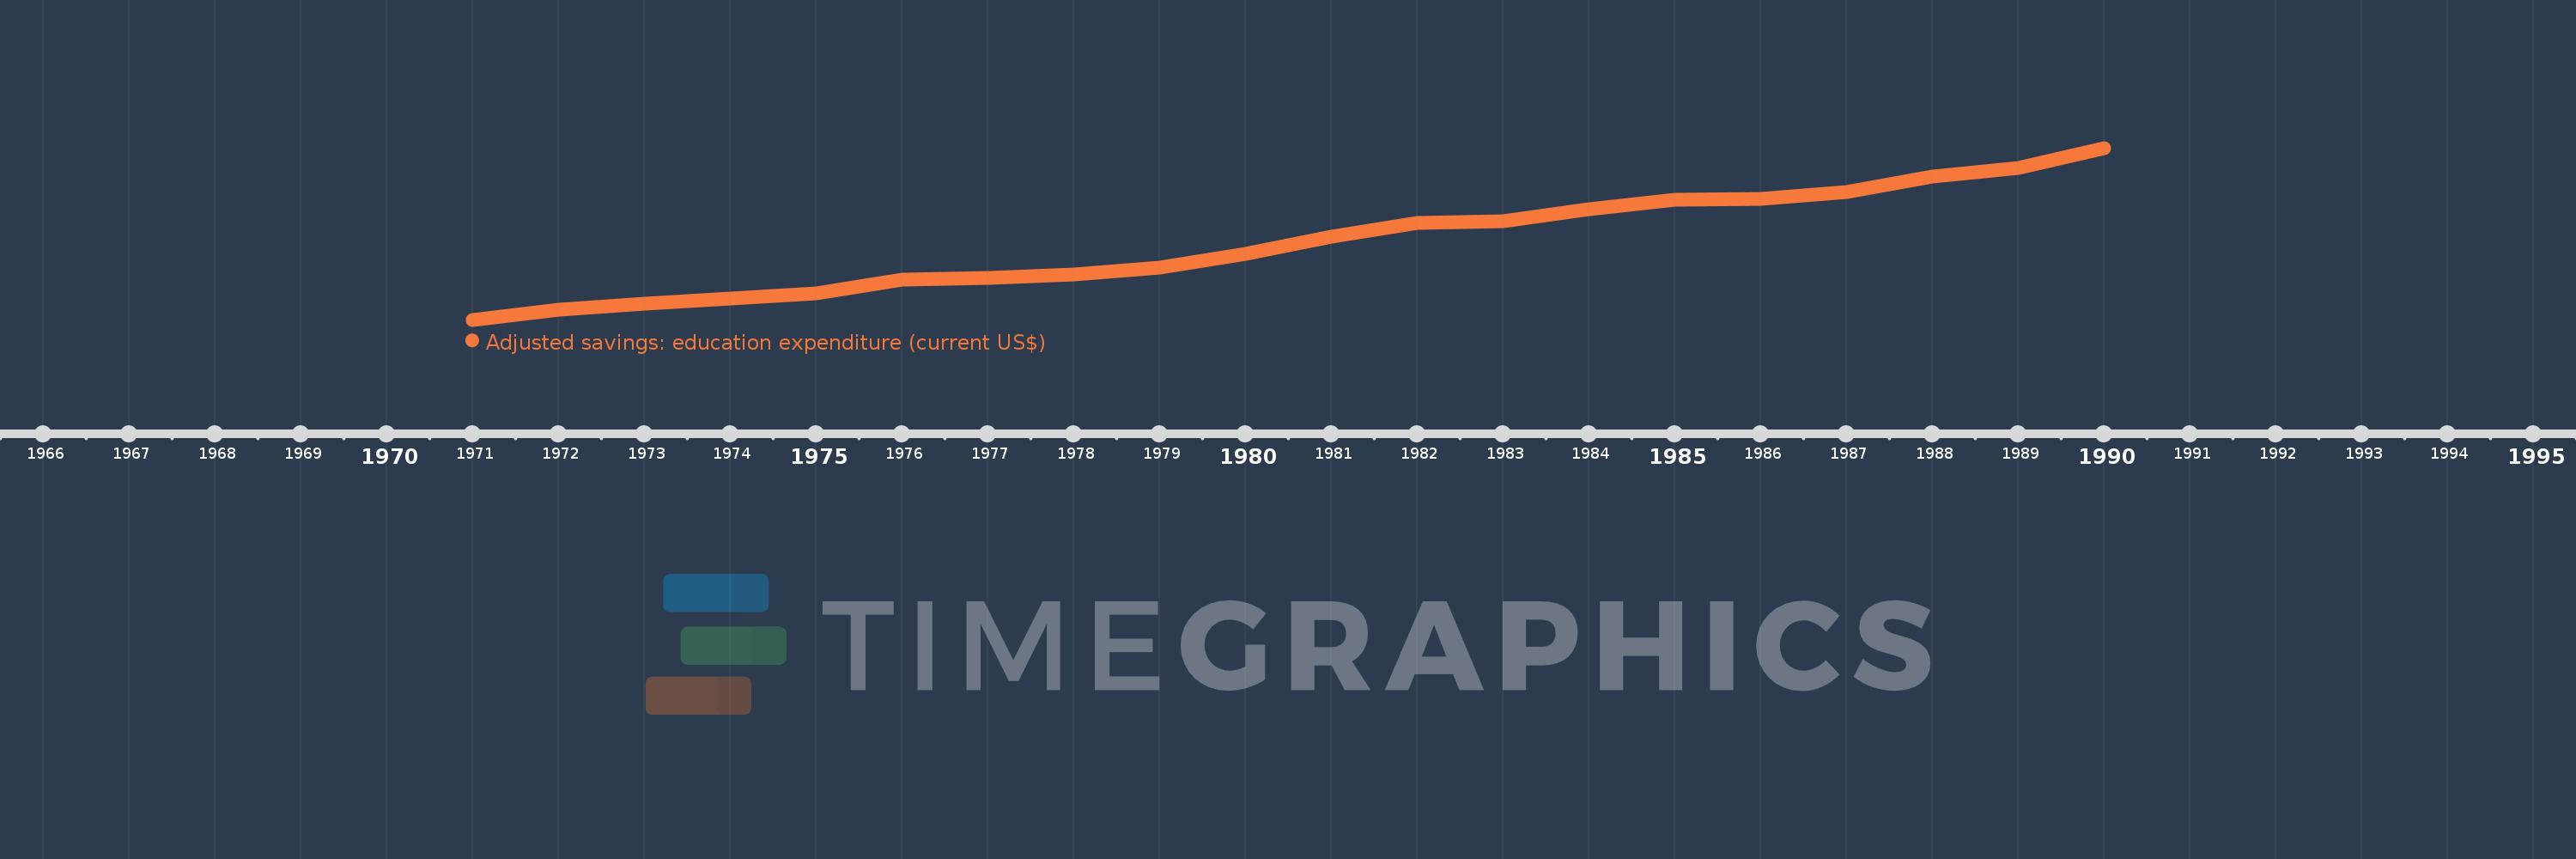
This timeline shows a graph from 1971 to 1990 of Virgin Islands (U.S.). No data until 1970. Number of actual observations by date: 20.
Source name:
World Development Indicators
Source organization:
World Bank staff estimates using data from the United Nations Statistics Division's Statistical Yearbook, and the UNESCO Institute for Statistics online database.
Categories, topics:
Economy & Growth, Environment
Last updated:
apr 23, 2017
Indicators value changes by year
Mean:
64.14 mln
Minimum:
13.985 mln
jan 1, 1971
Maximum:
125.738 mln
jan 1, 1990
At the date of observation
Value
Absolute change
Change from previous value
jan 1, 1971
13.985 mln
+13.985 mln
0.0%
jan 1, 1972
20.255 mln
+6.27 mln
44.83%
jan 1, 1973
24.194 mln
+3.939 mln
19.45%
jan 1, 1974
27.7 mln
+3.506 mln
14.49%
jan 1, 1975
31.151 mln
+3.451 mln
12.46%
jan 1, 1976
40.138 mln
+8.987 mln
28.85%
jan 1, 1977
41.167 mln
+1.029 mln
2.56%
jan 1, 1978
43.207 mln
+2.04 mln
4.95%
jan 1, 1979
47.988 mln
+4.781 mln
11.07%
jan 1, 1980
56.764 mln
+8.776 mln
18.29%
jan 1, 1981
68.094 mln
+11.33 mln
19.96%
jan 1, 1982
76.889 mln
+8.795 mln
12.92%
jan 1, 1983
77.9 mln
+1.01 mln
1.31%
jan 1, 1984
85.787 mln
+7.887 mln
10.12%
jan 1, 1985
92.196 mln
+6.409 mln
7.47%
jan 1, 1986
92.664 mln
+467.809K
0.51%
jan 1, 1987
96.893 mln
+4.229 mln
4.56%
jan 1, 1988
107.39 mln
+10.498 mln
10.83%
jan 1, 1989
112.705 mln
+5.314 mln
4.95%
jan 1, 1990
125.738 mln
+13.033 mln
11.56%
Ranking of countries by current statistics by years

Comments:

Send
PremiumAbout & FeedbackTermsPrivacy
logo
© 2022 Selected Technologies LLC – Morgan Hill, California