29
/
en
AIzaSyAYiBZKx7MnpbEhh9jyipgxe19OcubqV5w
April 1, 2024
158159
Iraq
IRQ
true
2
1
Adjusted savings: education expenditure (current US$)
2015,2014,2013,2012,2011,2010,2009,2008,2007,2006,2005,1991,1990,1989,1988,1987,1986,1985,1984,1983,1982,1981
Download
Global statistics library →Iraq →

Adjusted savings: education expenditure (current US$)

This statistics in other country:
AfghanistanAlbaniaAlgeriaAmerican SamoaAndorraAngolaAntigua and BarbudaArgentinaArmeniaAustraliaAustriaAzerbaijanBahamas, TheBahrainBangladeshBarbadosBelarusBelgiumBelizeBeninBermudaBhutanBoliviaBotswanaBrazilBrunei DarussalamBulgariaBurkina FasoBurundiCabo VerdeCambodiaCameroonCanadaCentral African RepublicChadChileChinaColombiaComorosCongo, Dem. Rep.Congo, Rep.Costa RicaCote d'IvoireCroatiaCubaCyprusCzech RepublicDenmarkDjiboutiDominicaDominican RepublicEcuadorEgypt, Arab Rep.El SalvadorEquatorial GuineaEritreaEstoniaEthiopiaFijiFinlandFranceFrench PolynesiaGabonGambia, TheGeorgiaGermanyGhanaGreeceGrenadaGuatemalaGuineaGuinea-BissauGuyanaHaitiHondurasHong Kong SAR, ChinaHungaryIcelandIndiaIndonesiaIran, Islamic Rep.IraqIrelandIsraelItalyJamaicaJapanJordanKazakhstanKenyaKiribatiKorea, Rep.KuwaitKyrgyz RepublicLao PDRLatviaLebanonLesothoLiberiaLibyaLiechtensteinLithuaniaLuxembourgMacao SAR, ChinaMacedonia, FYRMadagascarMalawiMalaysiaMaldivesMaliMaltaMarshall IslandsMauritaniaMauritiusMexicoMicronesia, Fed. Sts.MoldovaMonacoMongoliaMoroccoMozambiqueMyanmarNamibiaNepalNetherlandsNew CaledoniaNew ZealandNicaraguaNigerNigeriaNorwayOmanPakistanPanamaPapua New GuineaParaguayPeruPhilippinesPolandPortugalPuerto RicoQatarRomaniaRussian FederationRwandaSamoaSan MarinoSao Tome and PrincipeSaudi ArabiaSenegalSerbiaSeychellesSierra LeoneSingaporeSlovak RepublicSloveniaSolomon IslandsSomaliaSouth AfricaSpainSri LankaSt. Kitts and NevisSt. LuciaSt. Vincent and the GrenadinesSudanSurinameSwazilandSwedenSwitzerlandSyrian Arab RepublicTajikistanTanzaniaThailandTimor-LesteTogoTongaTrinidad and TobagoTunisiaTurkeyTurkmenistanUgandaUkraineUnited KingdomUnited StatesUruguayUzbekistanVanuatuVenezuela, RBVietnamVirgin Islands (U.S.)Yemen, Rep.ZambiaZimbabwe
Timeline:
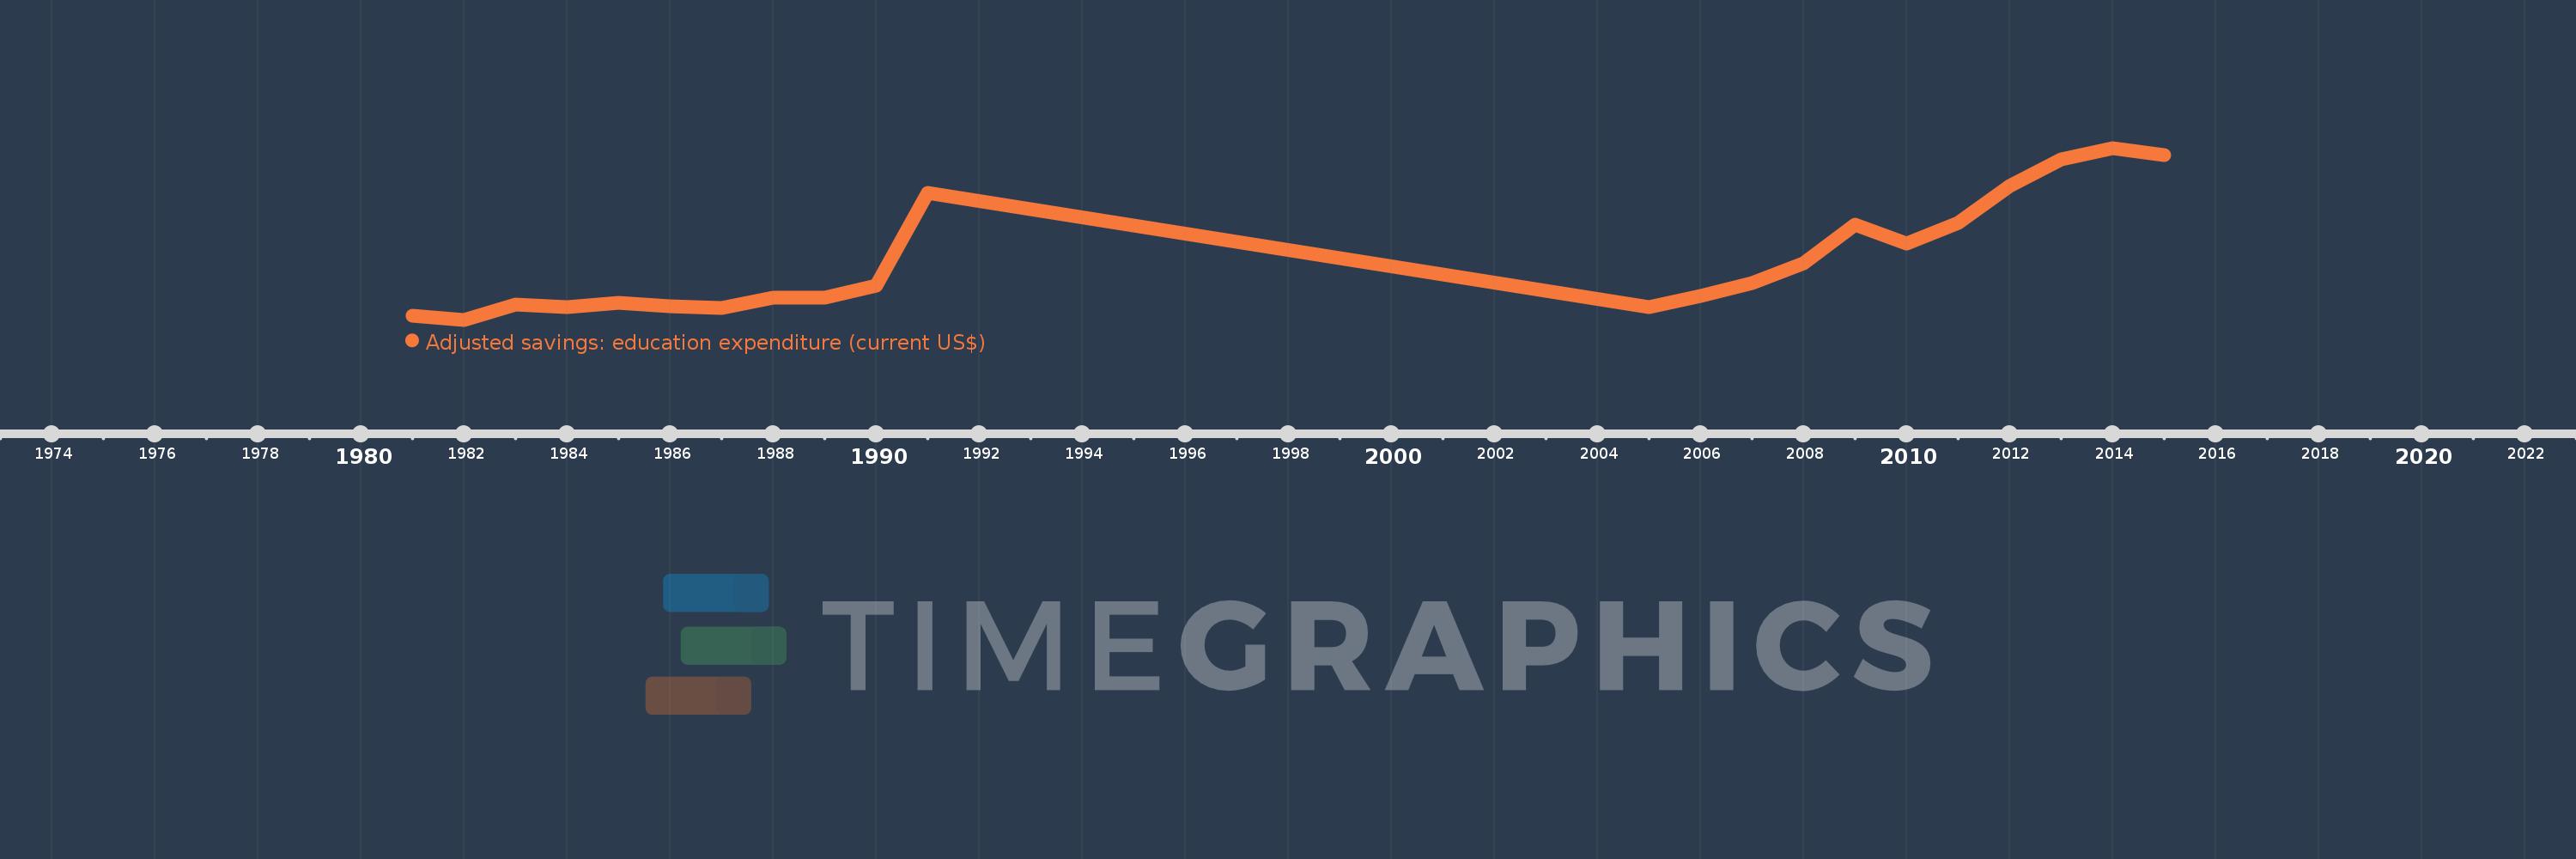
This timeline shows a graph from 1981 to 2015 of Iraq. No data until 1980. Number of actual observations by date: 22.
Source name:
World Development Indicators
Source organization:
World Bank staff estimates using data from the United Nations Statistics Division's Statistical Yearbook, and the UNESCO Institute for Statistics online database.
Categories, topics:
Economy & Growth, Environment
Last updated:
apr 23, 2017
Indicators value changes by year
Mean:
4.339 bln
Minimum:
963.743 mln
jan 1, 1982
Maximum:
10.718 bln
jan 1, 2014
At the date of observation
Value
Absolute change
Change from previous value
jan 1, 1981
1.21 bln
+1.21 bln
0.0%
jan 1, 1982
963.743 mln
-246.495 mln
-20.37%
jan 1, 1983
1.848 bln
+883.931 mln
91.72%
jan 1, 1984
1.703 bln
-145.006 mln
-7.85%
jan 1, 1985
1.902 bln
+199.476 mln
11.72%
jan 1, 1986
1.748 bln
-154.316 mln
-8.11%
jan 1, 1987
1.616 bln
-131.407 mln
-7.52%
jan 1, 1988
2.228 bln
+611.649 mln
37.84%
jan 1, 1989
2.229 bln
+1.188 mln
0.05%
jan 1, 1990
2.915 bln
+686.037 mln
30.77%
jan 1, 1991
8.151 bln
+5.236 bln
179.59%
jan 1, 2005
1.687 bln
-6.464 bln
-79.3%
jan 1, 2006
2.332 bln
+644.661 mln
38.21%
jan 1, 2007
3.038 bln
+705.692 mln
30.26%
jan 1, 2008
4.155 bln
+1.118 bln
36.8%
jan 1, 2009
6.378 bln
+2.222 bln
53.48%
jan 1, 2010
5.279 bln
-1.099 bln
-17.23%
jan 1, 2011
6.445 bln
+1.166 bln
22.09%
jan 1, 2012
8.535 bln
+2.09 bln
32.43%
jan 1, 2013
10.075 bln
+1.54 bln
18.04%
jan 1, 2014
10.718 bln
+642.712 mln
6.38%
jan 1, 2015
10.309 bln
-409.4 mln
-3.82%
Ranking of countries by current statistics by years

Comments:

Send
PremiumAbout & FeedbackTermsPrivacy
logo
© 2022 Selected Technologies LLC – Morgan Hill, California