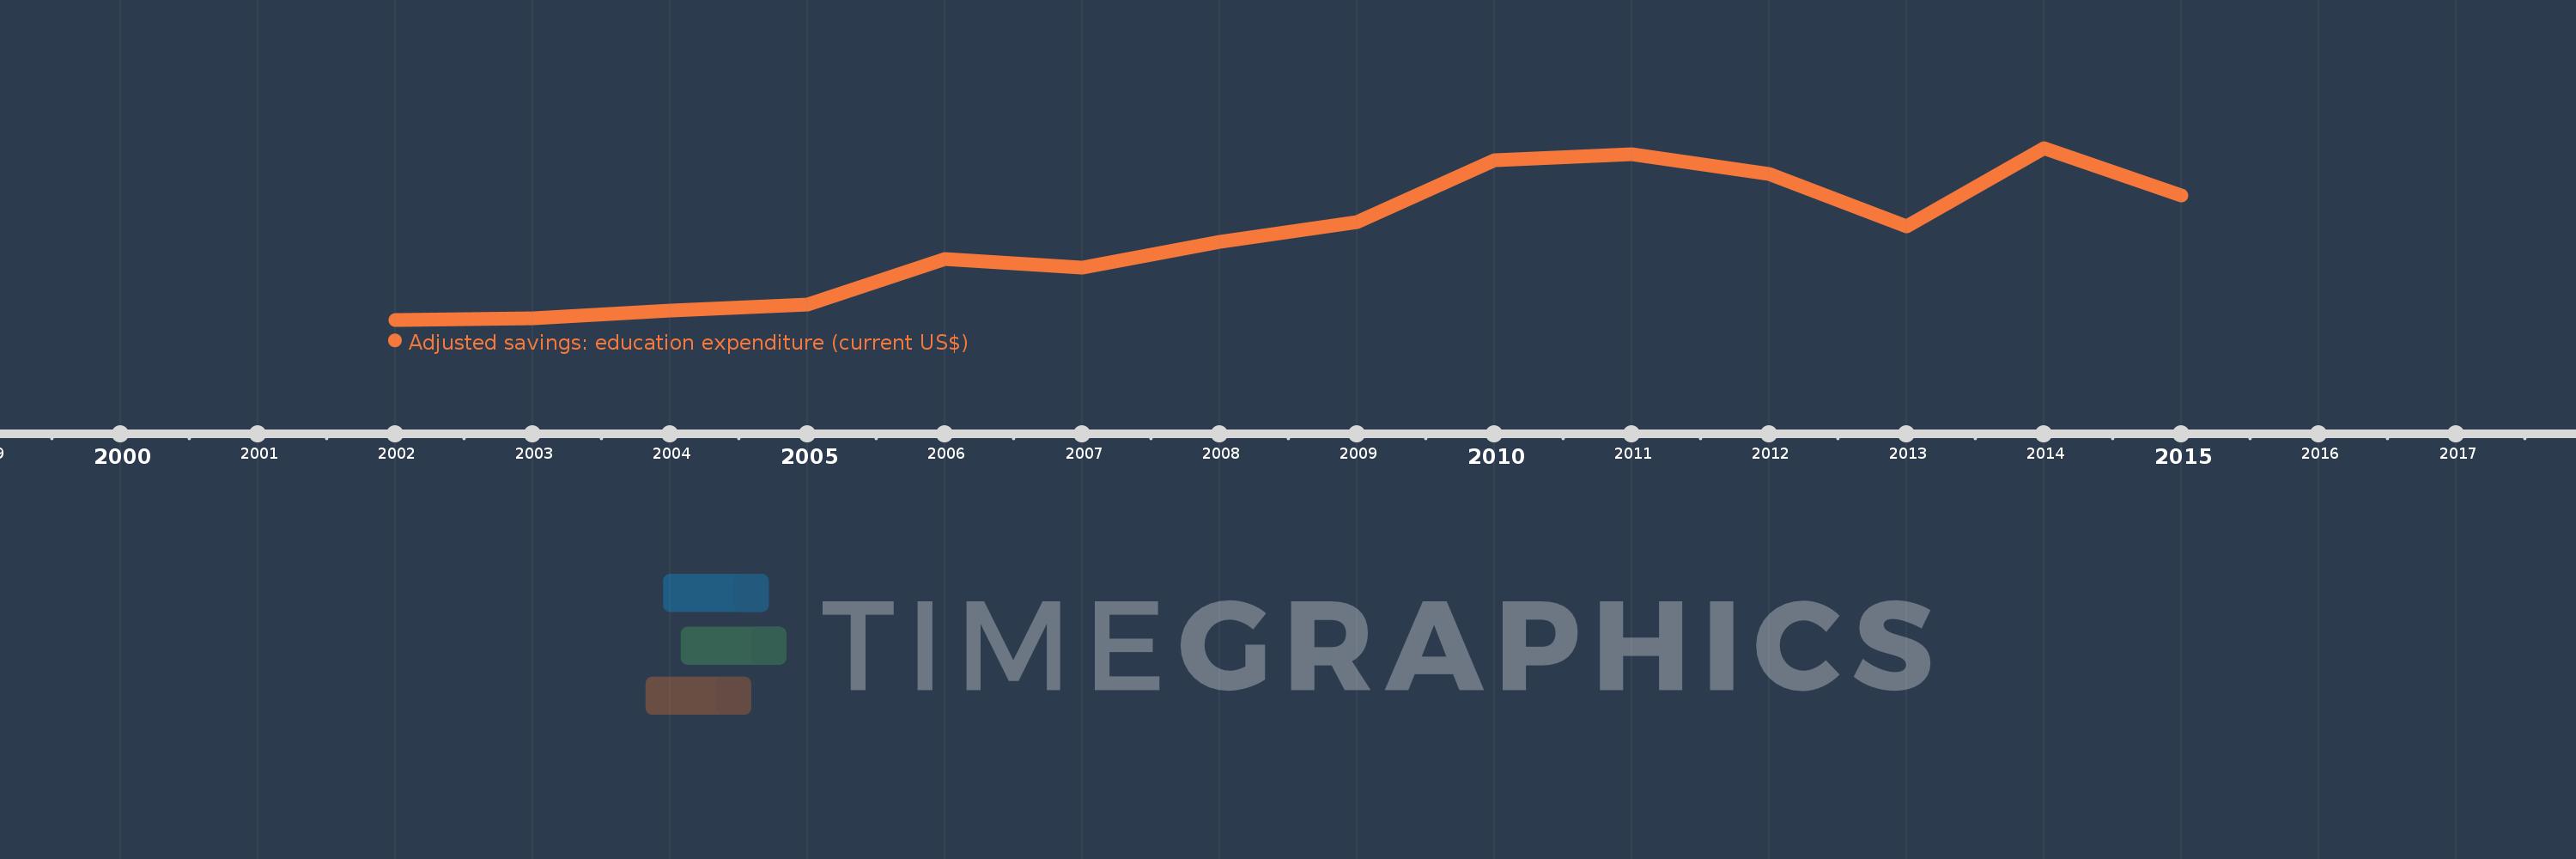
This timeline shows a graph from 2002 to 2015 of Sao Tome and Principe. No data until 2001. Number of actual observations by date: 14.
Source name:
World Development Indicators
Source organization:
World Bank staff estimates using data from the United Nations Statistics Division's Statistical Yearbook, and the UNESCO Institute for Statistics online database.
Categories, topics:
Economy & Growth, Environment
Last updated:
apr 23, 2017
Indicators value changes by year
Meaning:
8.374 mln
Minimum:
1.674 mln
jan 1, 2002
Maximum:
15.399 mln
jan 1, 2014
At the date of observation
Value
Absolute change
Change from the previous value
jan 1, 2002
1.674 mln
+1.674 mln
0.0%
jan 1, 2003
1.799 mln
+124.49K
7.44%
jan 1, 2004
2.383 mln
+584.653K
32.51%
jan 1, 2005
2.863 mln
+480.229K
20.15%
jan 1, 2006
6.496 mln
+3.633 mln
126.87%
jan 1, 2007
5.829 mln
-667.281K
-10.27%
jan 1, 2008
7.876 mln
+2.047 mln
35.12%
jan 1, 2009
9.457 mln
+1.581 mln
20.08%
jan 1, 2010
14.44 mln
+4.983 mln
52.69%
jan 1, 2011
14.922 mln
+482.436K
3.34%
jan 1, 2012
13.332 mln
-1.591 mln
-10.66%
jan 1, 2013
9.139 mln
-4.192 mln
-31.45%
jan 1, 2014
15.399 mln
+6.259 mln
68.49%
jan 1, 2015
11.626 mln
-3.773 mln
-24.5%
Ranking of countries by current statistics by years