29
/
en
AIzaSyAYiBZKx7MnpbEhh9jyipgxe19OcubqV5w
April 1, 2024
165750
Kazakhstan
KAZ
true
2
1
Adjusted savings: education expenditure (current US$)
2015,2014,2013,2012,2011,2010,2009,2008,2007,2006,2005,2004,2003,2002,2001,2000,1999,1998,1997,1996,1995,1994
Download
Global statistics library →Kazakhstan →

Adjusted savings: education expenditure (current US$)

This statistics in other country:
AfghanistanAlbaniaAlgeriaAmerican SamoaAndorraAngolaAntigua and BarbudaArgentinaArmeniaAustraliaAustriaAzerbaijanBahamas, TheBahrainBangladeshBarbadosBelarusBelgiumBelizeBeninBermudaBhutanBoliviaBotswanaBrazilBrunei DarussalamBulgariaBurkina FasoBurundiCabo VerdeCambodiaCameroonCanadaCentral African RepublicChadChileChinaColombiaComorosCongo, Dem. Rep.Congo, Rep.Costa RicaCote d'IvoireCroatiaCubaCyprusCzech RepublicDenmarkDjiboutiDominicaDominican RepublicEcuadorEgypt, Arab Rep.El SalvadorEquatorial GuineaEritreaEstoniaEthiopiaFijiFinlandFranceFrench PolynesiaGabonGambia, TheGeorgiaGermanyGhanaGreeceGrenadaGuatemalaGuineaGuinea-BissauGuyanaHaitiHondurasHong Kong SAR, ChinaHungaryIcelandIndiaIndonesiaIran, Islamic Rep.IraqIrelandIsraelItalyJamaicaJapanJordanKazakhstanKenyaKiribatiKorea, Rep.KuwaitKyrgyz RepublicLao PDRLatviaLebanonLesothoLiberiaLibyaLiechtensteinLithuaniaLuxembourgMacao SAR, ChinaMacedonia, FYRMadagascarMalawiMalaysiaMaldivesMaliMaltaMarshall IslandsMauritaniaMauritiusMexicoMicronesia, Fed. Sts.MoldovaMonacoMongoliaMoroccoMozambiqueMyanmarNamibiaNepalNetherlandsNew CaledoniaNew ZealandNicaraguaNigerNigeriaNorwayOmanPakistanPanamaPapua New GuineaParaguayPeruPhilippinesPolandPortugalPuerto RicoQatarRomaniaRussian FederationRwandaSamoaSan MarinoSao Tome and PrincipeSaudi ArabiaSenegalSerbiaSeychellesSierra LeoneSingaporeSlovak RepublicSloveniaSolomon IslandsSomaliaSouth AfricaSpainSri LankaSt. Kitts and NevisSt. LuciaSt. Vincent and the GrenadinesSudanSurinameSwazilandSwedenSwitzerlandSyrian Arab RepublicTajikistanTanzaniaThailandTimor-LesteTogoTongaTrinidad and TobagoTunisiaTurkeyTurkmenistanUgandaUkraineUnited KingdomUnited StatesUruguayUzbekistanVanuatuVenezuela, RBVietnamVirgin Islands (U.S.)Yemen, Rep.ZambiaZimbabwe
Timeline:
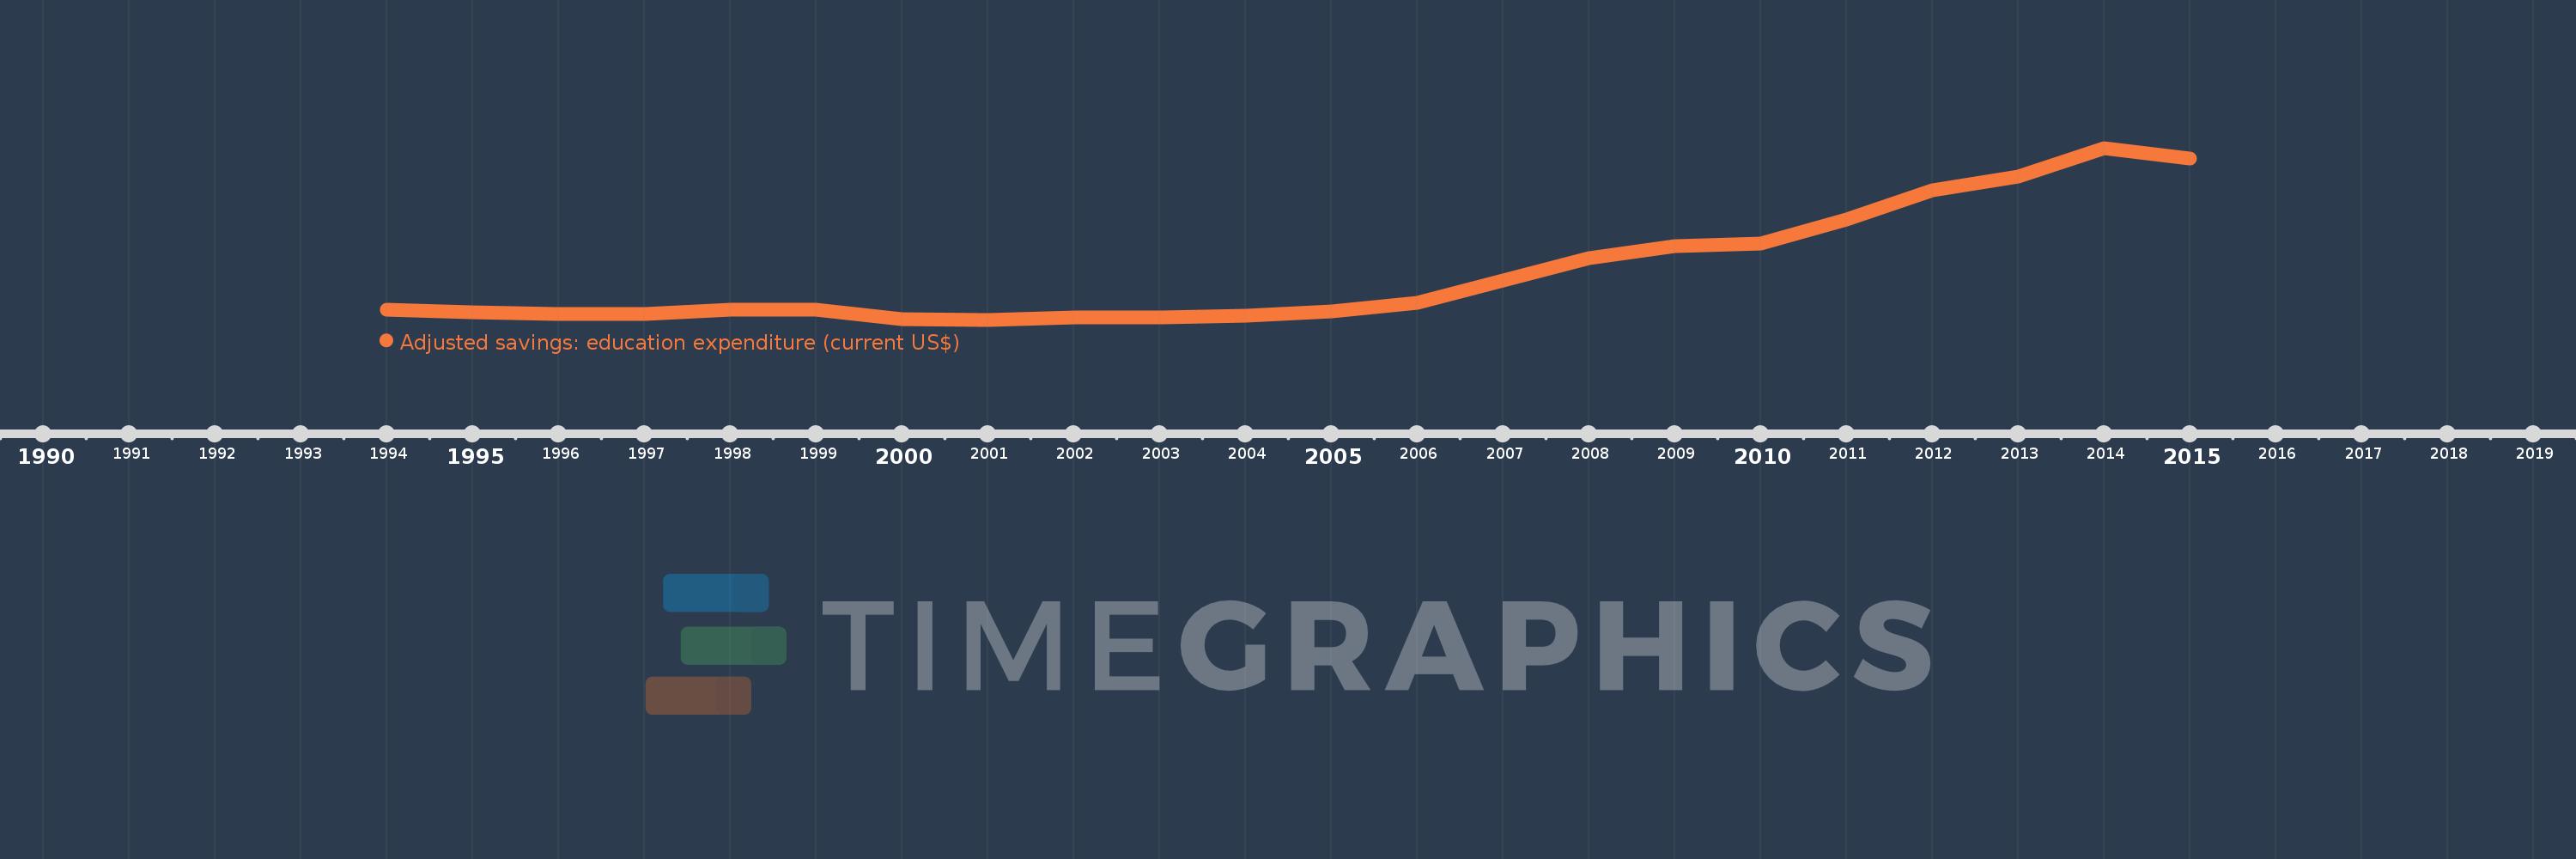
This timeline shows a graph from 1994 to 2015 of Kazakhstan. No data until 1993. Number of actual observations by date: 22.
Source name:
World Development Indicators
Source organization:
World Bank staff estimates using data from the United Nations Statistics Division's Statistical Yearbook, and the UNESCO Institute for Statistics online database.
Categories, topics:
Economy & Growth, Environment
Last updated:
apr 23, 2017
Indicators value changes by year
Mean:
2.231 bln
Minimum:
627.662 mln
jan 1, 2001
Maximum:
6.467 bln
jan 1, 2014
At the date of observation
Value
Absolute change
Change from previous value
jan 1, 1994
957.917 mln
+957.917 mln
0.0%
jan 1, 1995
867.324 mln
-90.593 mln
-9.46%
jan 1, 1996
829.381 mln
-37.943 mln
-4.37%
jan 1, 1997
811.795 mln
-17.586 mln
-2.12%
jan 1, 1998
961.445 mln
+149.65 mln
18.43%
jan 1, 1999
963.385 mln
+1.94 mln
0.2%
jan 1, 2000
660.012 mln
-303.373 mln
-31.49%
jan 1, 2001
627.662 mln
-32.35 mln
-4.9%
jan 1, 2002
694.227 mln
+66.565 mln
10.61%
jan 1, 2003
694.561 mln
+333.922K
0.05%
jan 1, 2004
760.257 mln
+65.696 mln
9.46%
jan 1, 2005
915.768 mln
+155.512 mln
20.46%
jan 1, 2006
1.213 bln
+297.255 mln
32.46%
jan 1, 2007
1.959 bln
+746.105 mln
61.51%
jan 1, 2008
2.725 bln
+766.185 mln
39.11%
jan 1, 2009
3.125 bln
+399.557 mln
14.66%
jan 1, 2010
3.212 bln
+87.492 mln
2.8%
jan 1, 2011
4.025 bln
+812.976 mln
25.31%
jan 1, 2012
5.015 bln
+990.067 mln
24.6%
jan 1, 2013
5.486 bln
+470.868 mln
9.39%
jan 1, 2014
6.467 bln
+980.776 mln
17.88%
jan 1, 2015
6.107 bln
-360.221 mln
-5.57%
Ranking of countries by current statistics by years

Comments:

Send
PremiumAbout & FeedbackTermsPrivacy
logo
© 2022 Selected Technologies LLC – Morgan Hill, California