29
/
en
AIzaSyAYiBZKx7MnpbEhh9jyipgxe19OcubqV5w
April 1, 2024
270258
Turkmenistan
TKM
true
2
1
Adjusted savings: education expenditure (current US$)
2015,2014,2013,2012,2011,2010,2009,2008,2007,2006,2005,2004,2003,2002,2001,2000,1999,1998,1997,1996,1995,1994
Download
Global statistics library →Turkmenistan →

Adjusted savings: education expenditure (current US$)

This statistics in other country:
AfghanistanAlbaniaAlgeriaAmerican SamoaAndorraAngolaAntigua and BarbudaArgentinaArmeniaAustraliaAustriaAzerbaijanBahamas, TheBahrainBangladeshBarbadosBelarusBelgiumBelizeBeninBermudaBhutanBoliviaBotswanaBrazilBrunei DarussalamBulgariaBurkina FasoBurundiCabo VerdeCambodiaCameroonCanadaCentral African RepublicChadChileChinaColombiaComorosCongo, Dem. Rep.Congo, Rep.Costa RicaCote d'IvoireCroatiaCubaCyprusCzech RepublicDenmarkDjiboutiDominicaDominican RepublicEcuadorEgypt, Arab Rep.El SalvadorEquatorial GuineaEritreaEstoniaEthiopiaFijiFinlandFranceFrench PolynesiaGabonGambia, TheGeorgiaGermanyGhanaGreeceGrenadaGuatemalaGuineaGuinea-BissauGuyanaHaitiHondurasHong Kong SAR, ChinaHungaryIcelandIndiaIndonesiaIran, Islamic Rep.IraqIrelandIsraelItalyJamaicaJapanJordanKazakhstanKenyaKiribatiKorea, Rep.KuwaitKyrgyz RepublicLao PDRLatviaLebanonLesothoLiberiaLibyaLiechtensteinLithuaniaLuxembourgMacao SAR, ChinaMacedonia, FYRMadagascarMalawiMalaysiaMaldivesMaliMaltaMarshall IslandsMauritaniaMauritiusMexicoMicronesia, Fed. Sts.MoldovaMonacoMongoliaMoroccoMozambiqueMyanmarNamibiaNepalNetherlandsNew CaledoniaNew ZealandNicaraguaNigerNigeriaNorwayOmanPakistanPanamaPapua New GuineaParaguayPeruPhilippinesPolandPortugalPuerto RicoQatarRomaniaRussian FederationRwandaSamoaSan MarinoSao Tome and PrincipeSaudi ArabiaSenegalSerbiaSeychellesSierra LeoneSingaporeSlovak RepublicSloveniaSolomon IslandsSomaliaSouth AfricaSpainSri LankaSt. Kitts and NevisSt. LuciaSt. Vincent and the GrenadinesSudanSurinameSwazilandSwedenSwitzerlandSyrian Arab RepublicTajikistanTanzaniaThailandTimor-LesteTogoTongaTrinidad and TobagoTunisiaTurkeyTurkmenistanUgandaUkraineUnited KingdomUnited StatesUruguayUzbekistanVanuatuVenezuela, RBVietnamVirgin Islands (U.S.)Yemen, Rep.ZambiaZimbabwe
Timeline:
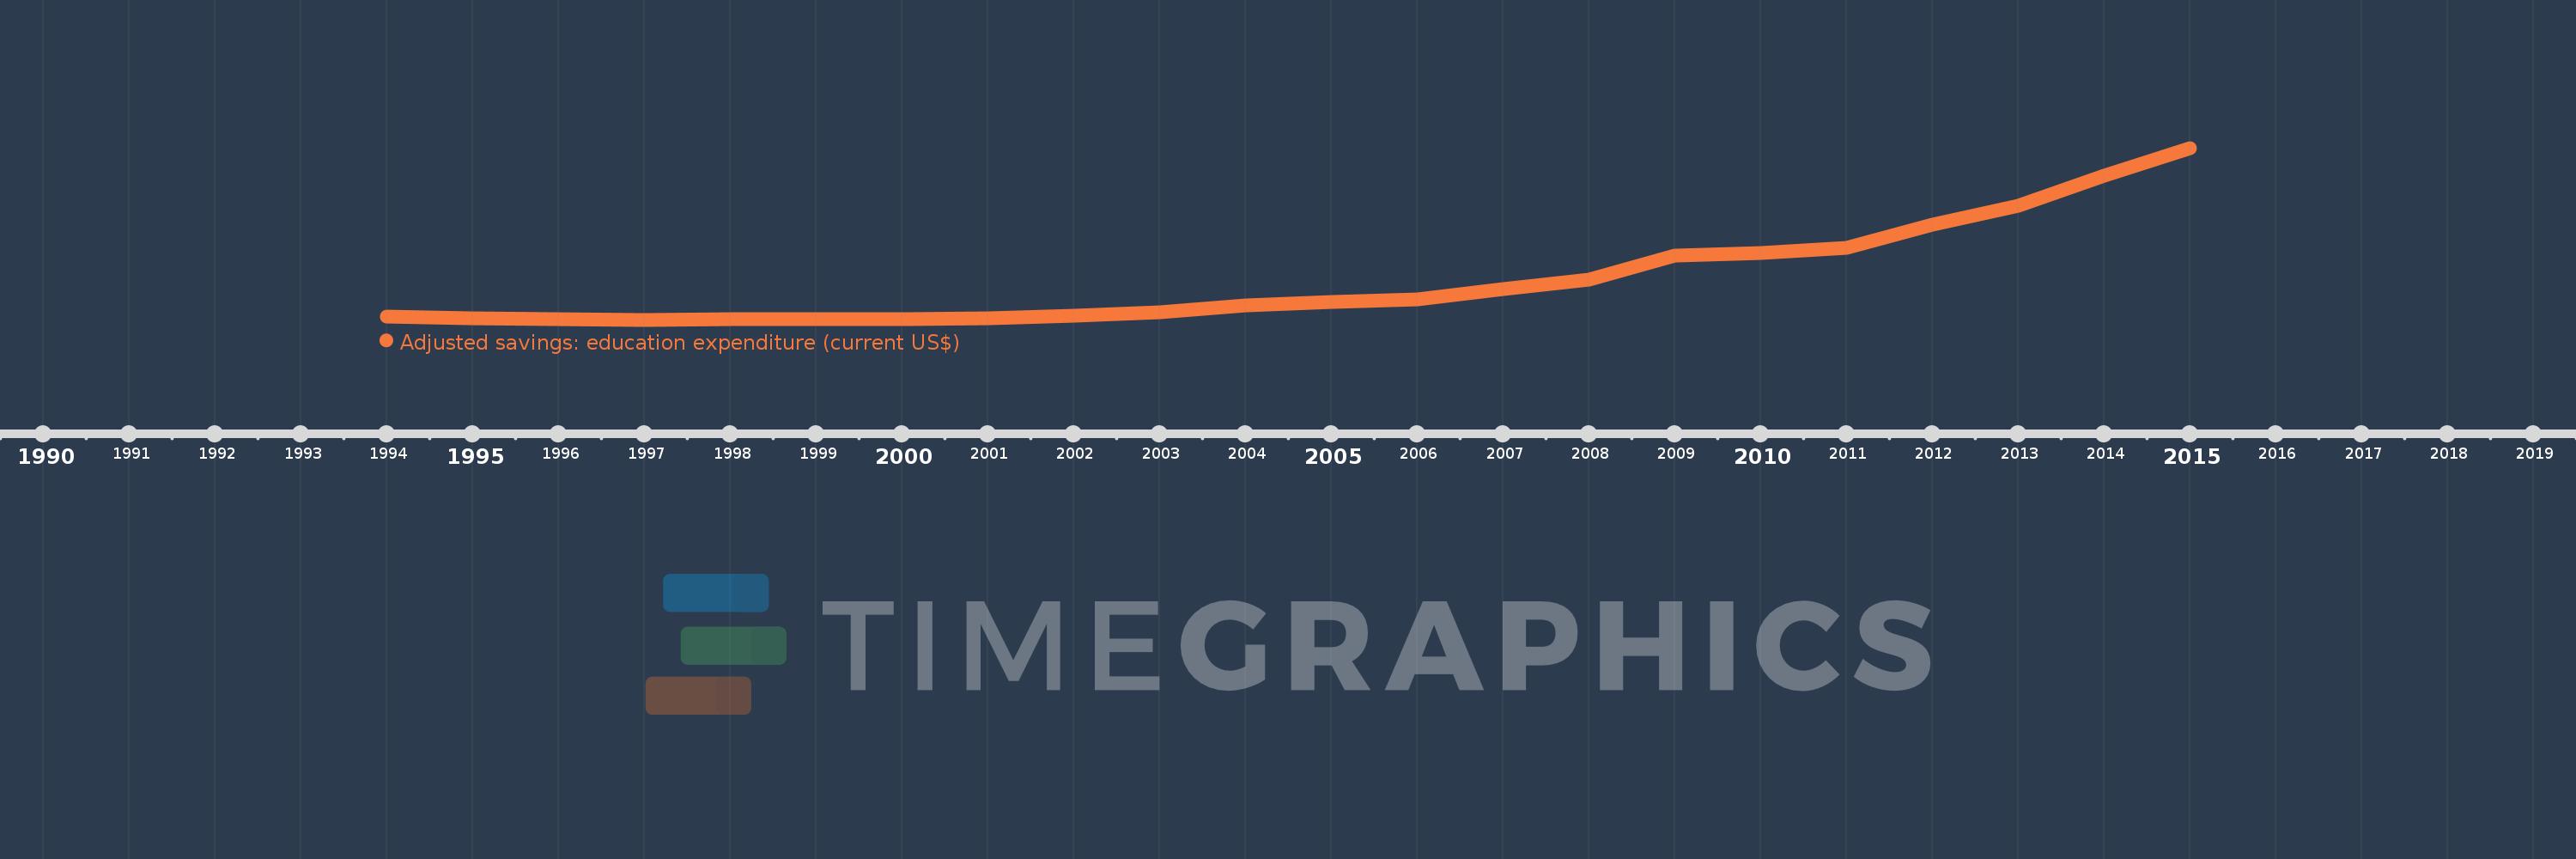
This timeline shows a graph from 1994 to 2015 of Turkmenistan. No data until 1993. Number of actual observations by date: 22.
Source name:
World Development Indicators
Source organization:
World Bank staff estimates using data from the United Nations Statistics Division's Statistical Yearbook, and the UNESCO Institute for Statistics online database.
Categories, topics:
Economy & Growth, Environment
Last updated:
apr 23, 2017
Indicators value changes by year
Mean:
282.979 mln
Minimum:
55.589 mln
jan 1, 1997
Maximum:
1.044 bln
jan 1, 2015
At the date of observation
Value
Absolute change
Change from previous value
jan 1, 1994
74.28 mln
+74.28 mln
0.0%
jan 1, 1995
61.538 mln
-12.742 mln
-17.15%
jan 1, 1996
58.015 mln
-3.524 mln
-5.73%
jan 1, 1997
55.589 mln
-2.425 mln
-4.18%
jan 1, 1998
58.809 mln
+3.22 mln
5.79%
jan 1, 1999
61.209 mln
+2.4 mln
4.08%
jan 1, 2000
56.724 mln
-4.486 mln
-7.33%
jan 1, 2001
63.275 mln
+6.552 mln
11.55%
jan 1, 2002
79.571 mln
+16.295 mln
25.75%
jan 1, 2003
100.682 mln
+21.111 mln
26.53%
jan 1, 2004
136.867 mln
+36.185 mln
35.94%
jan 1, 2005
156.167 mln
+19.3 mln
14.1%
jan 1, 2006
174.959 mln
+18.792 mln
12.03%
jan 1, 2007
231.464 mln
+56.504 mln
32.3%
jan 1, 2008
285.353 mln
+53.89 mln
23.28%
jan 1, 2009
423.068 mln
+137.714 mln
48.26%
jan 1, 2010
439.815 mln
+16.747 mln
3.96%
jan 1, 2011
469.894 mln
+30.079 mln
6.84%
jan 1, 2012
600.294 mln
+130.4 mln
27.75%
jan 1, 2013
710.579 mln
+110.285 mln
18.37%
jan 1, 2014
883.78 mln
+173.201 mln
24.37%
jan 1, 2015
1.044 bln
+159.824 mln
18.08%
Ranking of countries by current statistics by years

Comments:

Send
PremiumAbout & FeedbackTermsPrivacy
logo
© 2022 Selected Technologies LLC – Morgan Hill, California