29
/
en
AIzaSyAYiBZKx7MnpbEhh9jyipgxe19OcubqV5w
April 1, 2024
263176
Timor-Leste
TLS
true
2
1
Adjusted savings: education expenditure (current US$)
2015,2014,2013,2012,2011,2010,2009,2008,2007,2006,2005,2004,2003,2002,2001
Download
Global statistics library →Timor-Leste →

Adjusted savings: education expenditure (current US$)

This statistics in other country:
AfghanistanAlbaniaAlgeriaAmerican SamoaAndorraAngolaAntigua and BarbudaArgentinaArmeniaAustraliaAustriaAzerbaijanBahamas, TheBahrainBangladeshBarbadosBelarusBelgiumBelizeBeninBermudaBhutanBoliviaBotswanaBrazilBrunei DarussalamBulgariaBurkina FasoBurundiCabo VerdeCambodiaCameroonCanadaCentral African RepublicChadChileChinaColombiaComorosCongo, Dem. Rep.Congo, Rep.Costa RicaCote d'IvoireCroatiaCubaCyprusCzech RepublicDenmarkDjiboutiDominicaDominican RepublicEcuadorEgypt, Arab Rep.El SalvadorEquatorial GuineaEritreaEstoniaEthiopiaFijiFinlandFranceFrench PolynesiaGabonGambia, TheGeorgiaGermanyGhanaGreeceGrenadaGuatemalaGuineaGuinea-BissauGuyanaHaitiHondurasHong Kong SAR, ChinaHungaryIcelandIndiaIndonesiaIran, Islamic Rep.IraqIrelandIsraelItalyJamaicaJapanJordanKazakhstanKenyaKiribatiKorea, Rep.KuwaitKyrgyz RepublicLao PDRLatviaLebanonLesothoLiberiaLibyaLiechtensteinLithuaniaLuxembourgMacao SAR, ChinaMacedonia, FYRMadagascarMalawiMalaysiaMaldivesMaliMaltaMarshall IslandsMauritaniaMauritiusMexicoMicronesia, Fed. Sts.MoldovaMonacoMongoliaMoroccoMozambiqueMyanmarNamibiaNepalNetherlandsNew CaledoniaNew ZealandNicaraguaNigerNigeriaNorwayOmanPakistanPanamaPapua New GuineaParaguayPeruPhilippinesPolandPortugalPuerto RicoQatarRomaniaRussian FederationRwandaSamoaSan MarinoSao Tome and PrincipeSaudi ArabiaSenegalSerbiaSeychellesSierra LeoneSingaporeSlovak RepublicSloveniaSolomon IslandsSomaliaSouth AfricaSpainSri LankaSt. Kitts and NevisSt. LuciaSt. Vincent and the GrenadinesSudanSurinameSwazilandSwedenSwitzerlandSyrian Arab RepublicTajikistanTanzaniaThailandTimor-LesteTogoTongaTrinidad and TobagoTunisiaTurkeyTurkmenistanUgandaUkraineUnited KingdomUnited StatesUruguayUzbekistanVanuatuVenezuela, RBVietnamVirgin Islands (U.S.)Yemen, Rep.ZambiaZimbabwe
Timeline:
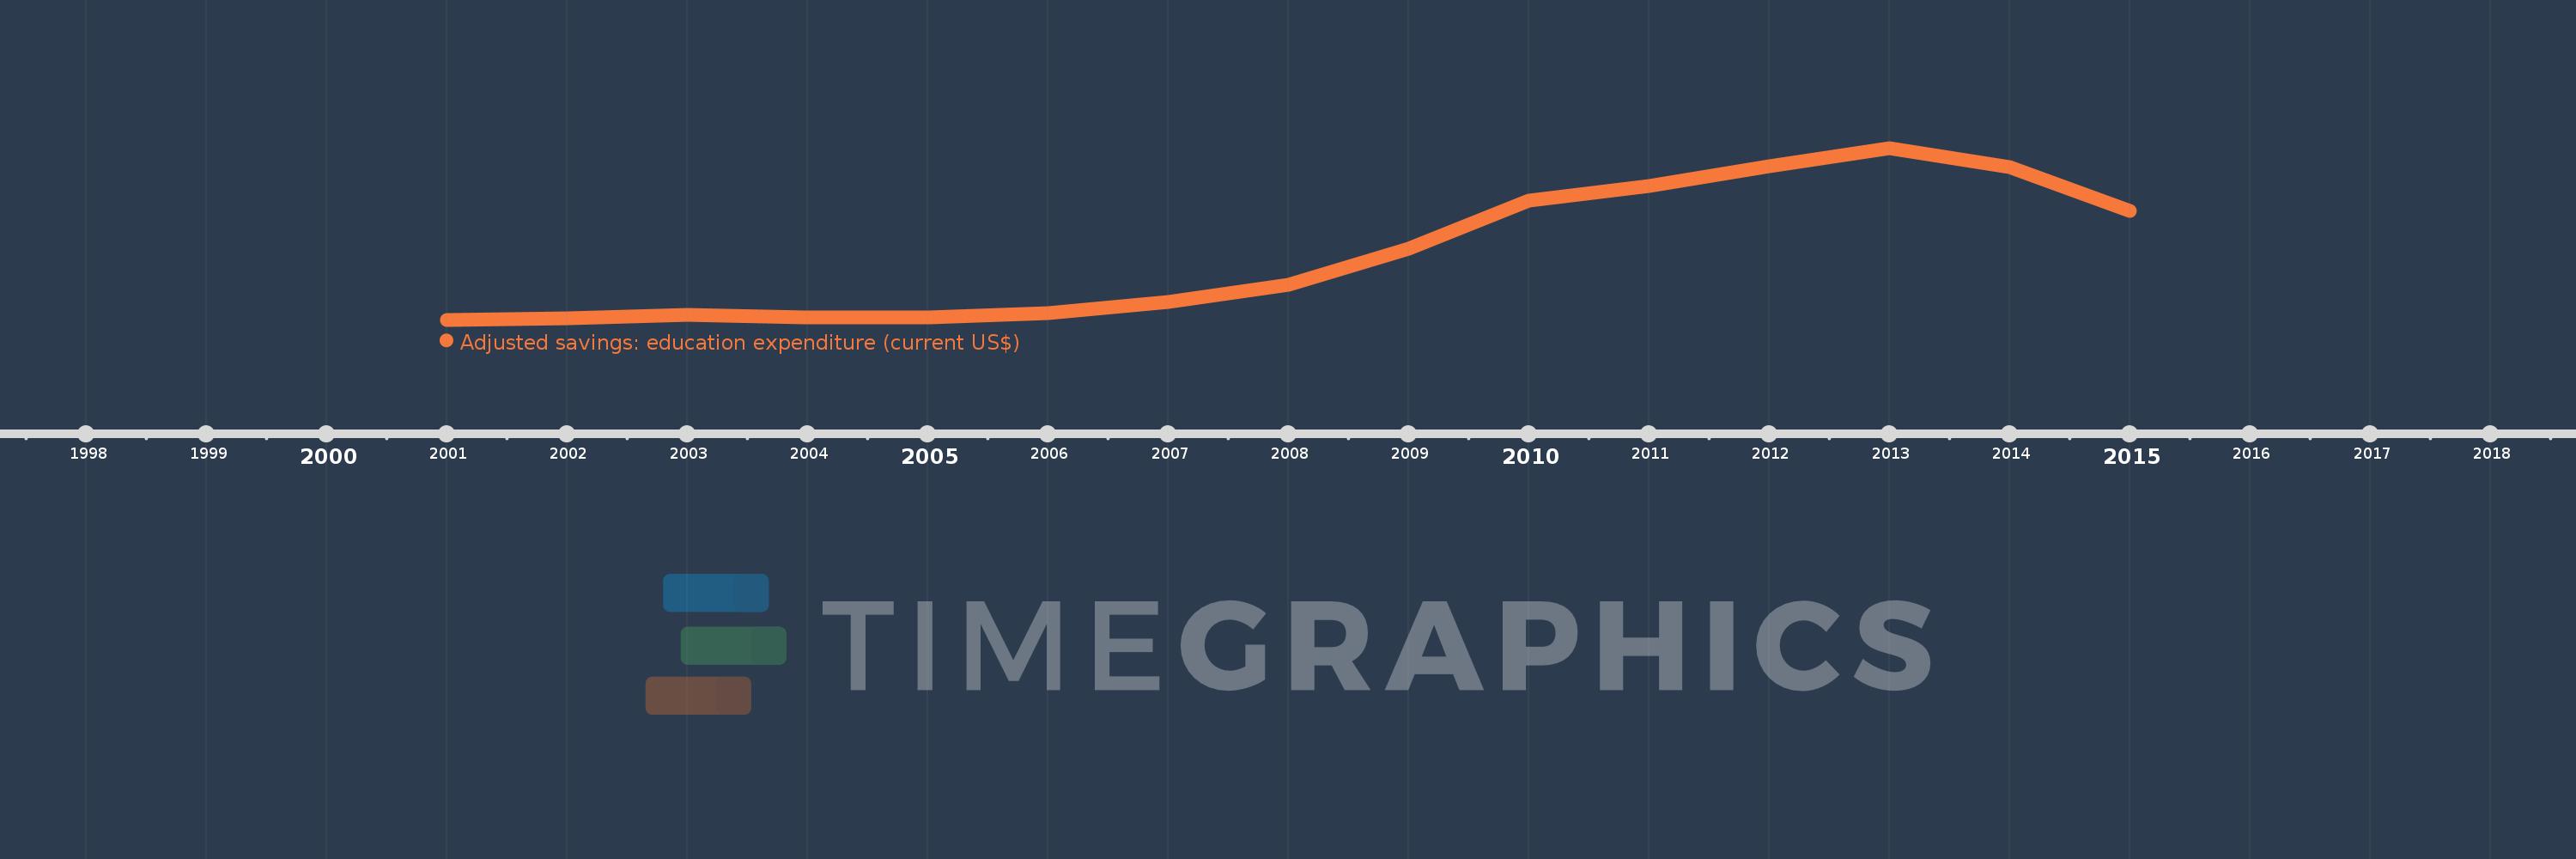
This timeline shows a graph from 2001 to 2015 of Timor-Leste. No data until 2000. Number of actual observations by date: 15.
Source name:
World Development Indicators
Source organization:
World Bank staff estimates using data from the United Nations Statistics Division's Statistical Yearbook, and the UNESCO Institute for Statistics online database.
Categories, topics:
Economy & Growth, Environment
Last updated:
apr 23, 2017
Indicators value changes by year
Mean:
44.62 mln
Minimum:
8.614 mln
jan 1, 2001
Maximum:
103.031 mln
jan 1, 2013
At the date of observation
Value
Absolute change
Change from previous value
jan 1, 2001
8.614 mln
+8.614 mln
0.0%
jan 1, 2002
9.475 mln
+861.4K
10.0%
jan 1, 2003
11.286 mln
+1.81 mln
19.11%
jan 1, 2004
9.84 mln
-1.445 mln
-12.81%
jan 1, 2005
10.059 mln
+219.0K
2.23%
jan 1, 2006
12.162 mln
+2.102 mln
20.9%
jan 1, 2007
18.542 mln
+6.38 mln
52.46%
jan 1, 2008
28.061 mln
+9.519 mln
51.34%
jan 1, 2009
47.552 mln
+19.491 mln
69.46%
jan 1, 2010
74.238 mln
+26.686 mln
56.12%
jan 1, 2011
82.188 mln
+7.95 mln
10.71%
jan 1, 2012
92.909 mln
+10.721 mln
13.04%
jan 1, 2013
103.031 mln
+10.123 mln
10.9%
jan 1, 2014
92.718 mln
-10.314 mln
-10.01%
jan 1, 2015
68.631 mln
-24.087 mln
-25.98%
Ranking of countries by current statistics by years

Comments:

Send
PremiumAbout & FeedbackTermsPrivacy
logo
© 2022 Selected Technologies LLC – Morgan Hill, California