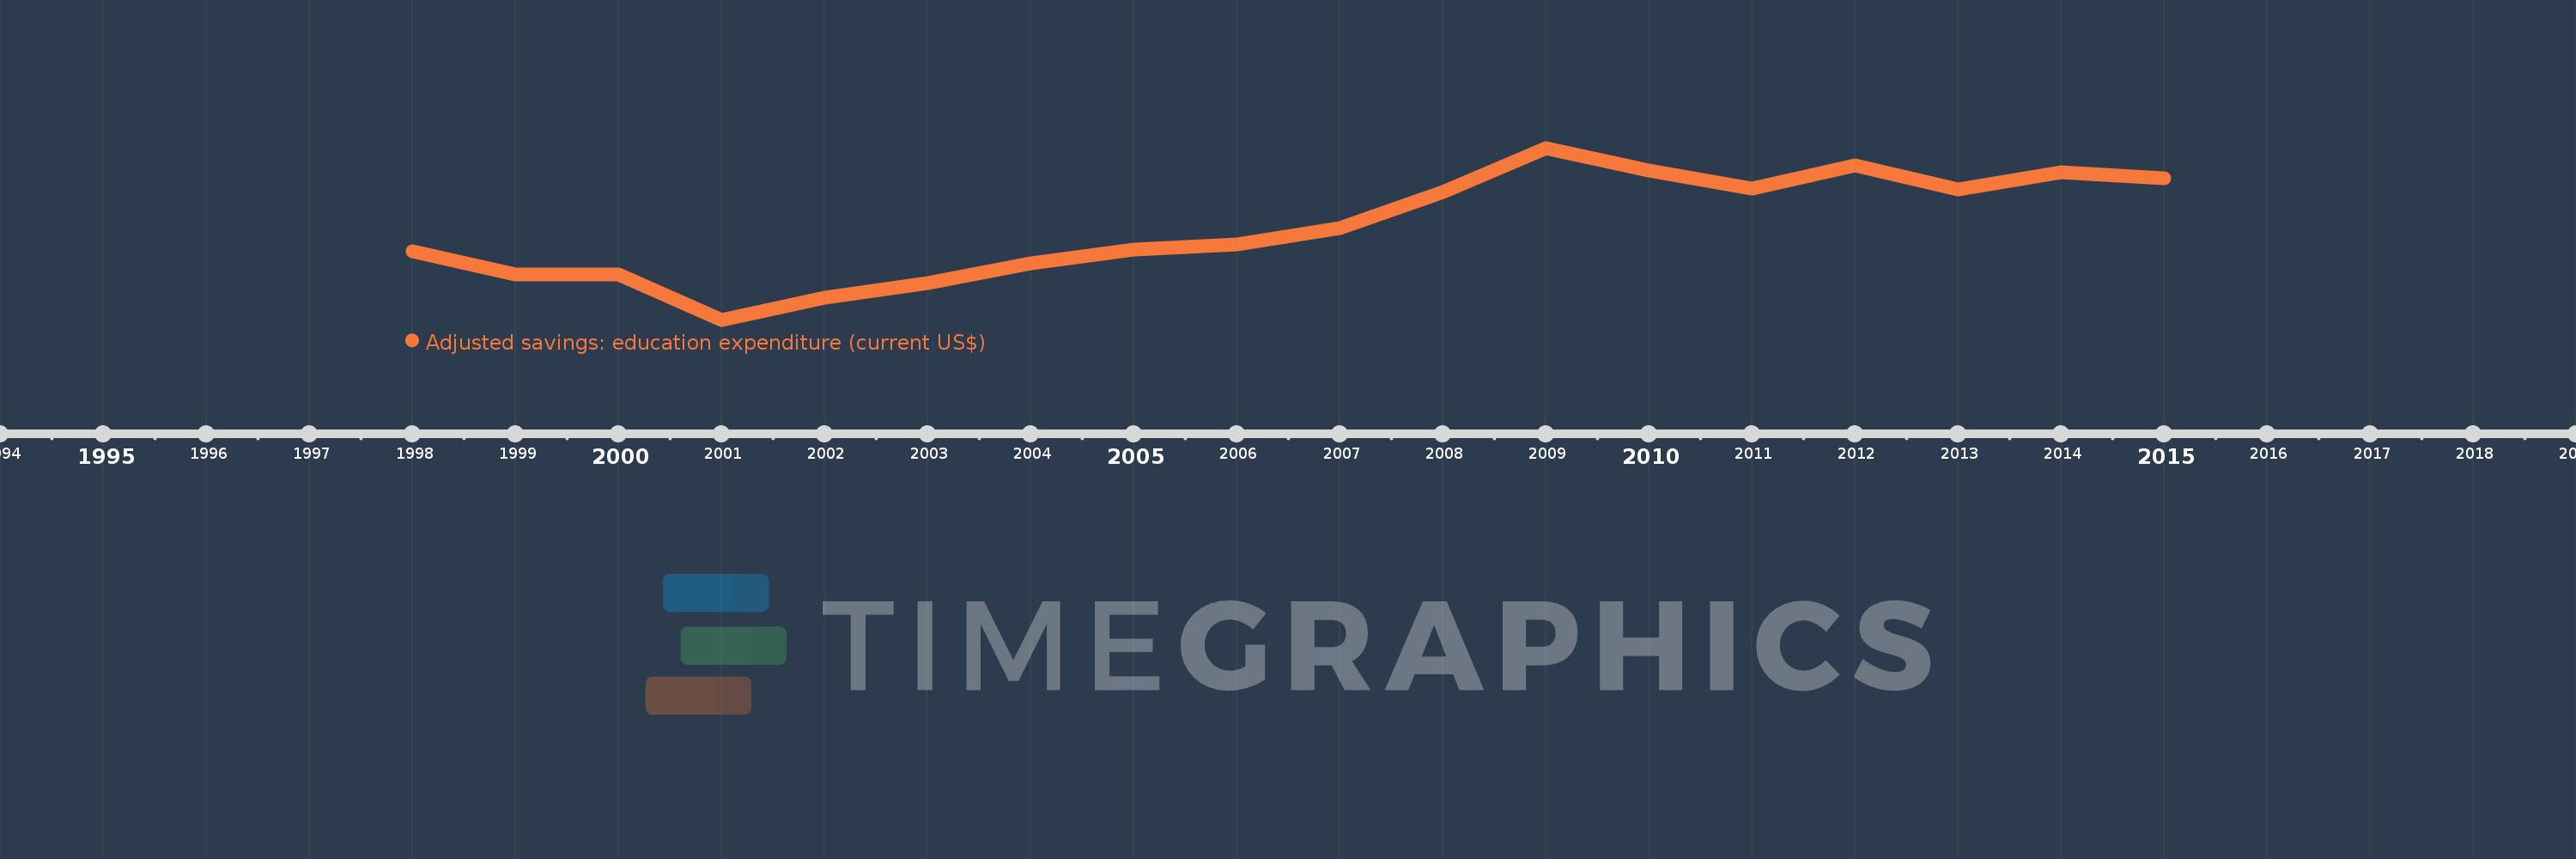
This timeline shows a graph from 1998 to 2015 of Serbia. No data until 1997. Number of actual observations by date: 18.
Source name:
World Development Indicators
Source organization:
World Bank staff estimates using data from the United Nations Statistics Division's Statistical Yearbook, and the UNESCO Institute for Statistics online database.
Categories, topics:
Economy & Growth, Environment
Last updated:
apr 23, 2017
Indicators value changes by year
Meaning:
1.332 bln
Minimum:
287.107 mln
jan 1, 2001
Maximum:
2.228 bln
jan 1, 2009
At the date of observation
Value
Absolute change
Change from the previous value
jan 1, 1998
1.061 bln
+1.061 bln
0.0%
jan 1, 1999
800.203 mln
-260.947 mln
-24.59%
jan 1, 2000
803.136 mln
+2.933 mln
0.37%
jan 1, 2001
287.107 mln
-516.029 mln
-64.25%
jan 1, 2002
538.794 mln
+251.687 mln
87.66%
jan 1, 2003
704.483 mln
+165.689 mln
30.75%
jan 1, 2004
924.248 mln
+219.765 mln
31.2%
jan 1, 2005
1.082 bln
+157.681 mln
17.06%
jan 1, 2006
1.138 bln
+56.358 mln
5.21%
jan 1, 2007
1.326 bln
+187.245 mln
16.45%
jan 1, 2008
1.733 bln
+407.169 mln
30.72%
jan 1, 2009
2.228 bln
+494.857 mln
28.56%
jan 1, 2010
1.97 bln
-257.465 mln
-11.56%
jan 1, 2011
1.766 bln
-203.656 mln
-10.34%
jan 1, 2012
2.034 bln
+268.024 mln
15.17%
jan 1, 2013
1.758 bln
-276.661 mln
-13.6%
jan 1, 2014
1.95 bln
+192.535 mln
10.95%
jan 1, 2015
1.881 bln
-69.666 mln
-3.57%
Ranking of countries by current statistics by years