29
/
en
AIzaSyAYiBZKx7MnpbEhh9jyipgxe19OcubqV5w
April 1, 2024
180770
Lithuania
LTU
true
2
1
Adjusted savings: education expenditure (current US$)
2015,2014,2013,2012,2011,2010,2009,2008,2007,2006,2005,2004,2003,2002,2001,2000,1999,1998,1997,1996
Download
Global statistics library →Lithuania →

Adjusted savings: education expenditure (current US$)

This statistics in other country:
AfghanistanAlbaniaAlgeriaAmerican SamoaAndorraAngolaAntigua and BarbudaArgentinaArmeniaAustraliaAustriaAzerbaijanBahamas, TheBahrainBangladeshBarbadosBelarusBelgiumBelizeBeninBermudaBhutanBoliviaBotswanaBrazilBrunei DarussalamBulgariaBurkina FasoBurundiCabo VerdeCambodiaCameroonCanadaCentral African RepublicChadChileChinaColombiaComorosCongo, Dem. Rep.Congo, Rep.Costa RicaCote d'IvoireCroatiaCubaCyprusCzech RepublicDenmarkDjiboutiDominicaDominican RepublicEcuadorEgypt, Arab Rep.El SalvadorEquatorial GuineaEritreaEstoniaEthiopiaFijiFinlandFranceFrench PolynesiaGabonGambia, TheGeorgiaGermanyGhanaGreeceGrenadaGuatemalaGuineaGuinea-BissauGuyanaHaitiHondurasHong Kong SAR, ChinaHungaryIcelandIndiaIndonesiaIran, Islamic Rep.IraqIrelandIsraelItalyJamaicaJapanJordanKazakhstanKenyaKiribatiKorea, Rep.KuwaitKyrgyz RepublicLao PDRLatviaLebanonLesothoLiberiaLibyaLiechtensteinLithuaniaLuxembourgMacao SAR, ChinaMacedonia, FYRMadagascarMalawiMalaysiaMaldivesMaliMaltaMarshall IslandsMauritaniaMauritiusMexicoMicronesia, Fed. Sts.MoldovaMonacoMongoliaMoroccoMozambiqueMyanmarNamibiaNepalNetherlandsNew CaledoniaNew ZealandNicaraguaNigerNigeriaNorwayOmanPakistanPanamaPapua New GuineaParaguayPeruPhilippinesPolandPortugalPuerto RicoQatarRomaniaRussian FederationRwandaSamoaSan MarinoSao Tome and PrincipeSaudi ArabiaSenegalSerbiaSeychellesSierra LeoneSingaporeSlovak RepublicSloveniaSolomon IslandsSomaliaSouth AfricaSpainSri LankaSt. Kitts and NevisSt. LuciaSt. Vincent and the GrenadinesSudanSurinameSwazilandSwedenSwitzerlandSyrian Arab RepublicTajikistanTanzaniaThailandTimor-LesteTogoTongaTrinidad and TobagoTunisiaTurkeyTurkmenistanUgandaUkraineUnited KingdomUnited StatesUruguayUzbekistanVanuatuVenezuela, RBVietnamVirgin Islands (U.S.)Yemen, Rep.ZambiaZimbabwe
Timeline:
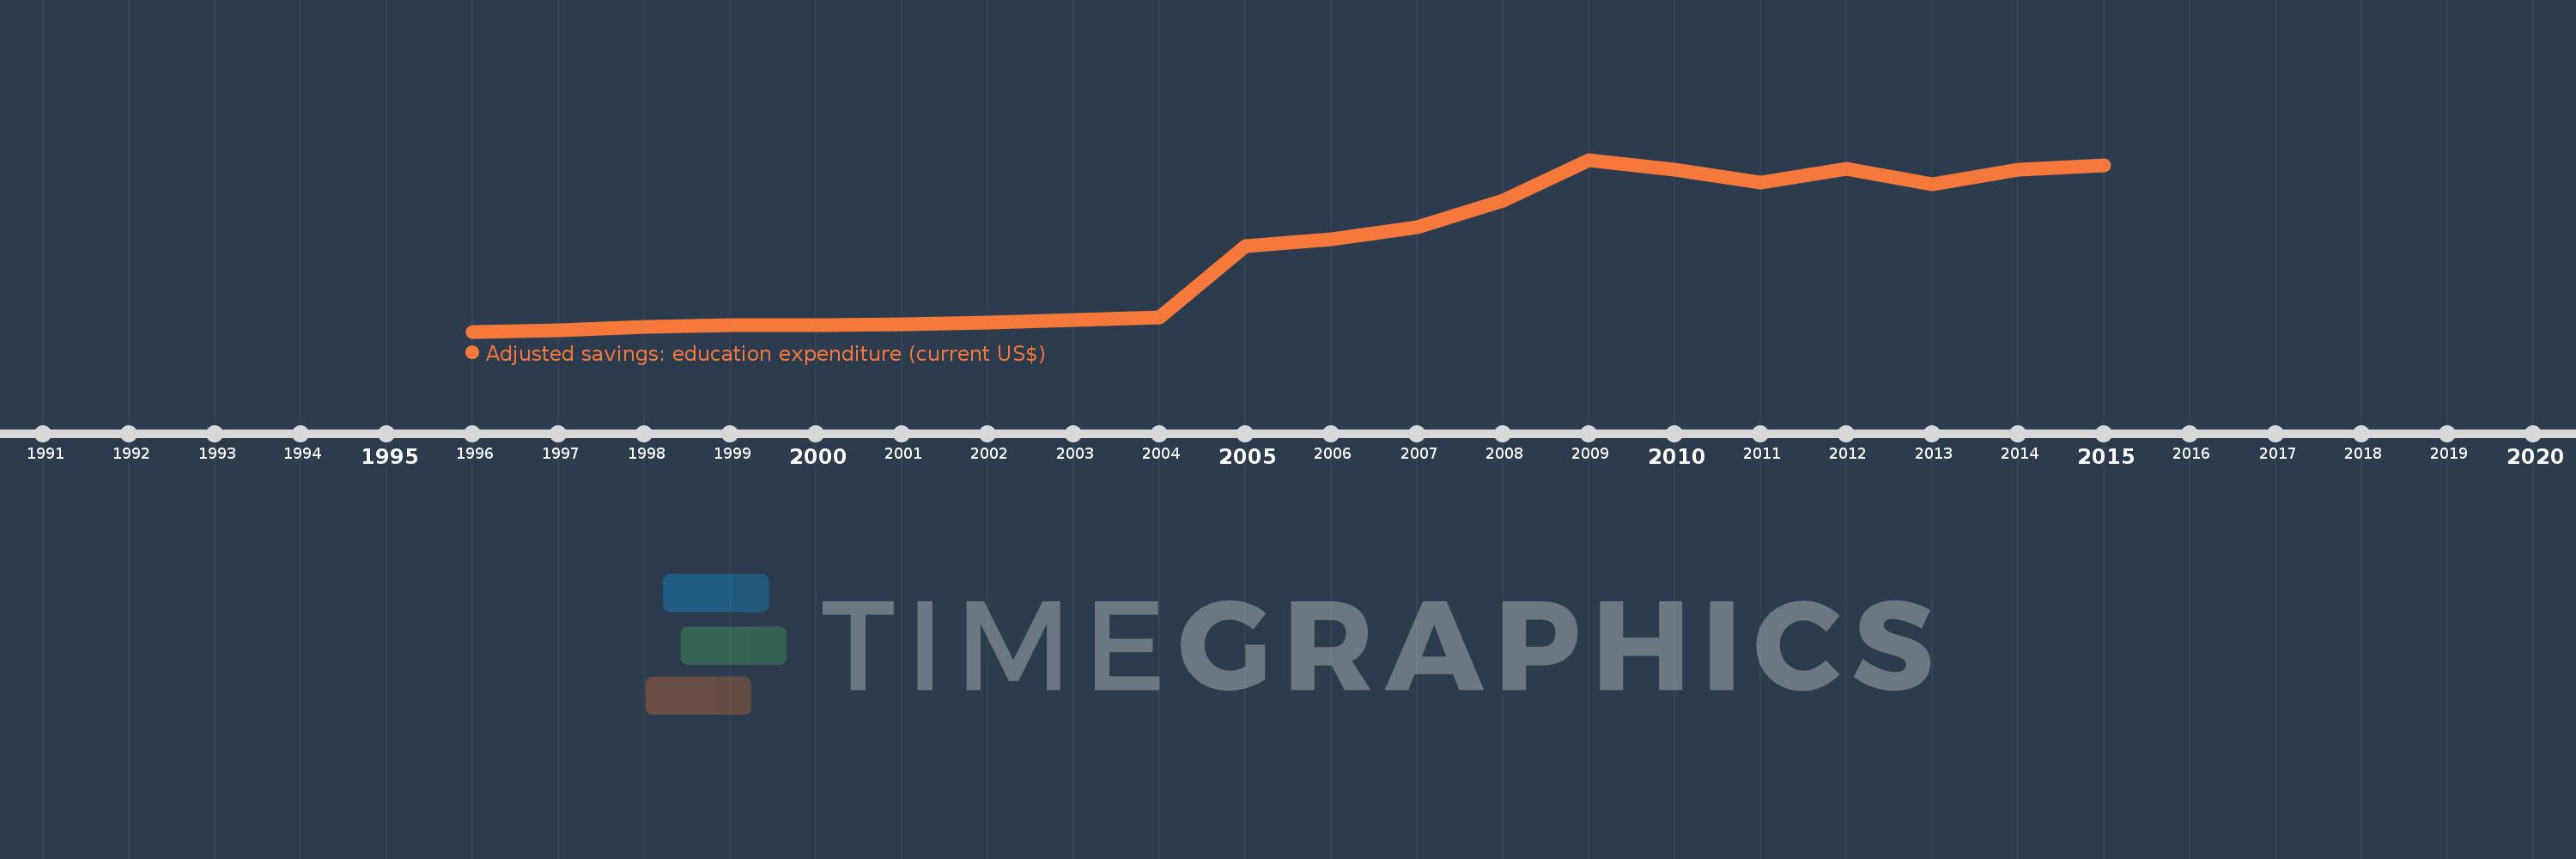
This timeline shows a graph from 1996 to 2015 of Lithuania. No data until 1995. Number of actual observations by date: 20.
Source name:
World Development Indicators
Source organization:
World Bank staff estimates using data from the United Nations Statistics Division's Statistical Yearbook, and the UNESCO Institute for Statistics online database.
Categories, topics:
Economy & Growth, Environment
Last updated:
apr 23, 2017
Indicators value changes by year
Mean:
3.61 bln
Minimum:
345.739 mln
jan 1, 1996
Maximum:
7.38 bln
jan 1, 2009
At the date of observation
Value
Absolute change
Change from previous value
jan 1, 1996
345.739 mln
+345.739 mln
0.0%
jan 1, 1997
382.101 mln
+36.362 mln
10.52%
jan 1, 1998
527.299 mln
+145.198 mln
38.0%
jan 1, 1999
607.326 mln
+80.027 mln
15.18%
jan 1, 2000
602.823 mln
-4.503 mln
-0.74%
jan 1, 2001
648.624 mln
+45.801 mln
7.6%
jan 1, 2002
701.647 mln
+53.023 mln
8.17%
jan 1, 2003
804.57 mln
+102.923 mln
14.67%
jan 1, 2004
926.954 mln
+122.384 mln
15.21%
jan 1, 2005
3.857 bln
+2.93 bln
316.09%
jan 1, 2006
4.143 bln
+285.886 mln
7.41%
jan 1, 2007
4.637 bln
+493.827 mln
11.92%
jan 1, 2008
5.699 bln
+1.062 bln
22.91%
jan 1, 2009
7.38 bln
+1.681 bln
29.5%
jan 1, 2010
6.988 bln
-392.15 mln
-5.31%
jan 1, 2011
6.442 bln
-546.543 mln
-7.82%
jan 1, 2012
7.008 bln
+566.791 mln
8.8%
jan 1, 2013
6.376 bln
-632.364 mln
-9.02%
jan 1, 2014
6.965 bln
+588.521 mln
9.23%
jan 1, 2015
7.154 bln
+189.389 mln
2.72%
Ranking of countries by current statistics by years

Comments:

Send
PremiumAbout & FeedbackTermsPrivacy
logo
© 2022 Selected Technologies LLC – Morgan Hill, California