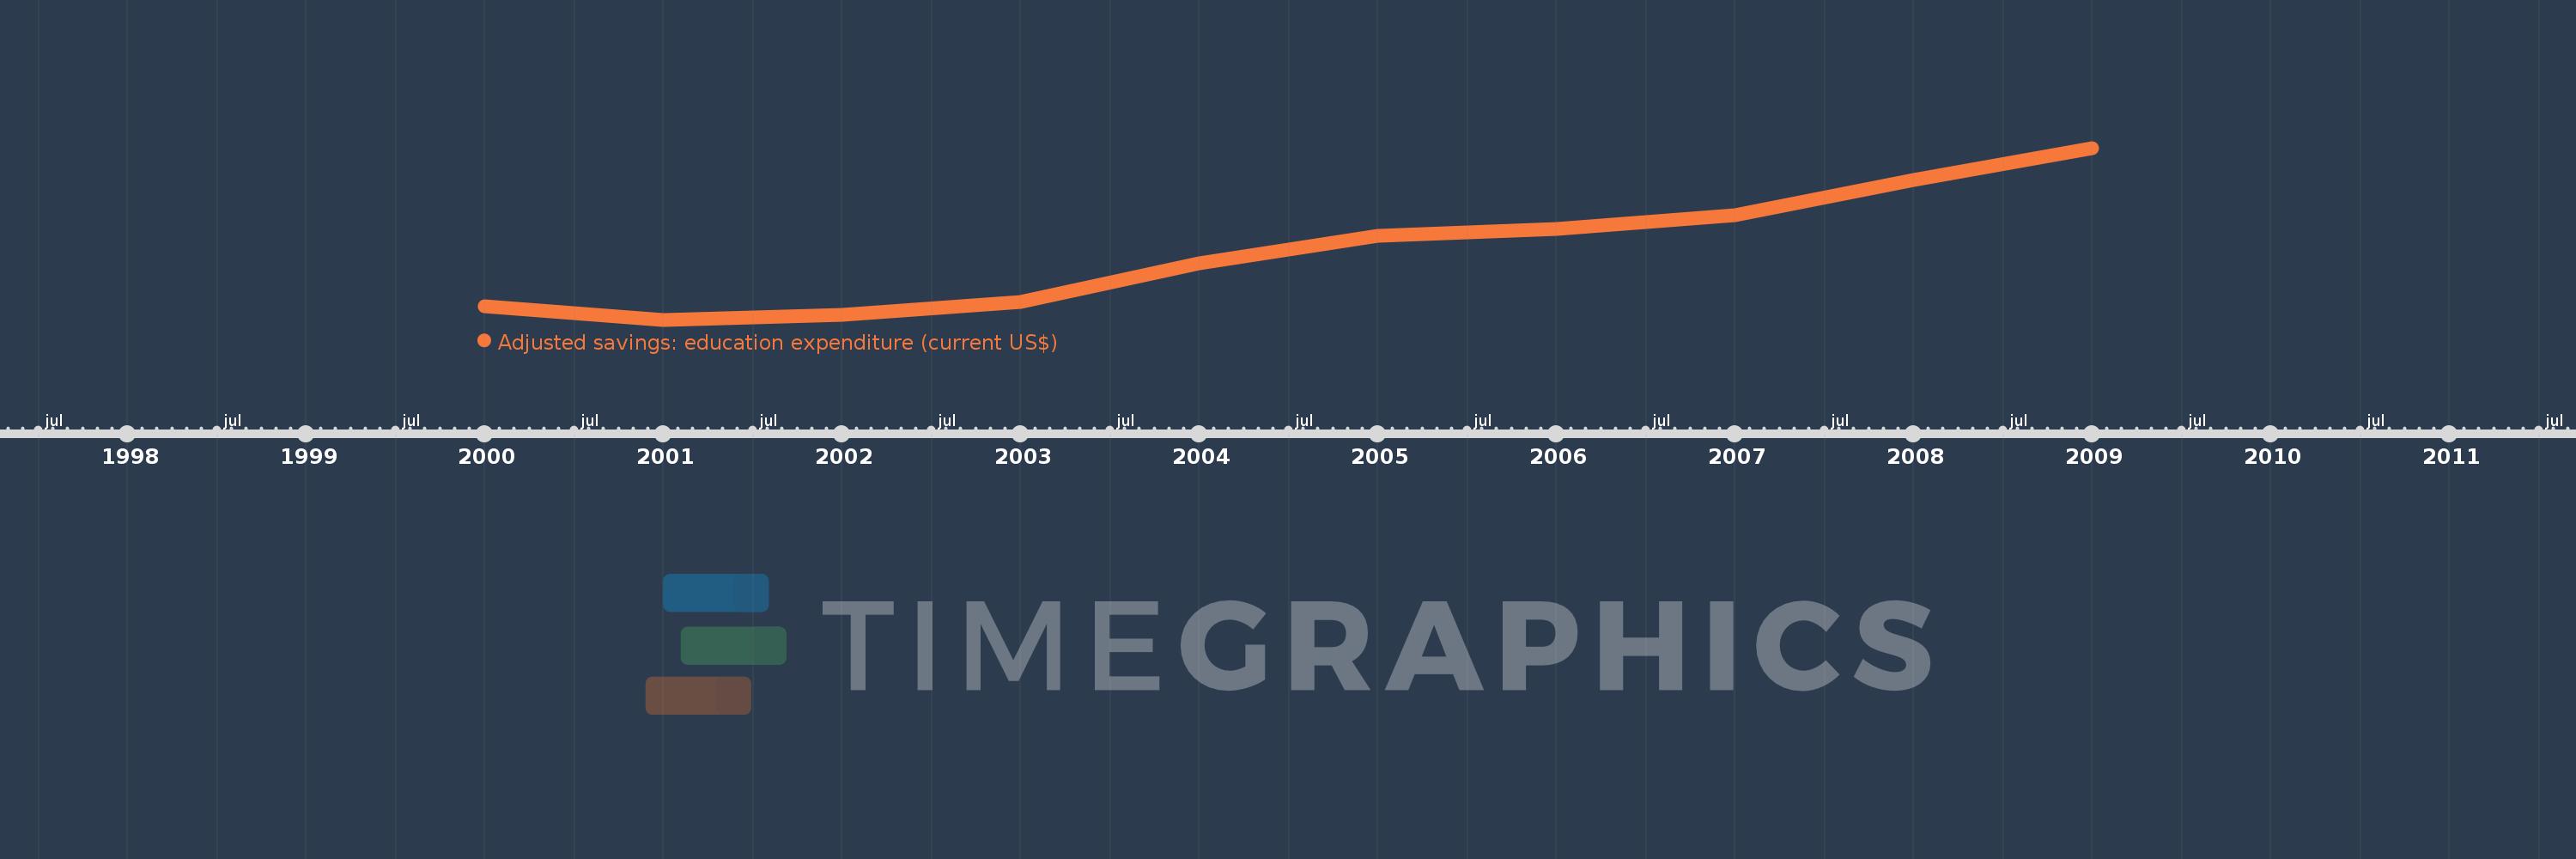
This timeline shows a graph from 2000 to 2009 of San Marino. No data until 1999. Number of actual observations by date: 10.
Source name:
World Development Indicators
Source organization:
World Bank staff estimates using data from the United Nations Statistics Division's Statistical Yearbook, and the UNESCO Institute for Statistics online database.
Categories, topics:
Economy & Growth, Environment
Last updated:
apr 23, 2017
Indicators value changes by year
Meaning:
38.222 mln
Minimum:
24.046 mln
jan 1, 2001
Maximum:
59.696 mln
jan 1, 2009
At the date of observation
Value
Absolute change
Change from the previous value
jan 1, 2000
26.822 mln
+26.822 mln
0.0%
jan 1, 2001
24.046 mln
-2.776 mln
-10.35%
jan 1, 2002
25.103 mln
+1.057 mln
4.39%
jan 1, 2003
27.704 mln
+2.602 mln
10.36%
jan 1, 2004
35.709 mln
+8.004 mln
28.89%
jan 1, 2005
41.532 mln
+5.824 mln
16.31%
jan 1, 2006
42.835 mln
+1.303 mln
3.14%
jan 1, 2007
45.749 mln
+2.914 mln
6.8%
jan 1, 2008
53.025 mln
+7.276 mln
15.9%
jan 1, 2009
59.696 mln
+6.671 mln
12.58%
Ranking of countries by current statistics by years